Everything described above — the step-by-step hedging, the delta accumulation at a major strike, the exhaustion when the hedge completes — played out visibly on April 15, 2026. Here is what the GEX chart showed in real time.
A large position, a fast rally, and a delta flip that marked the intraday high:
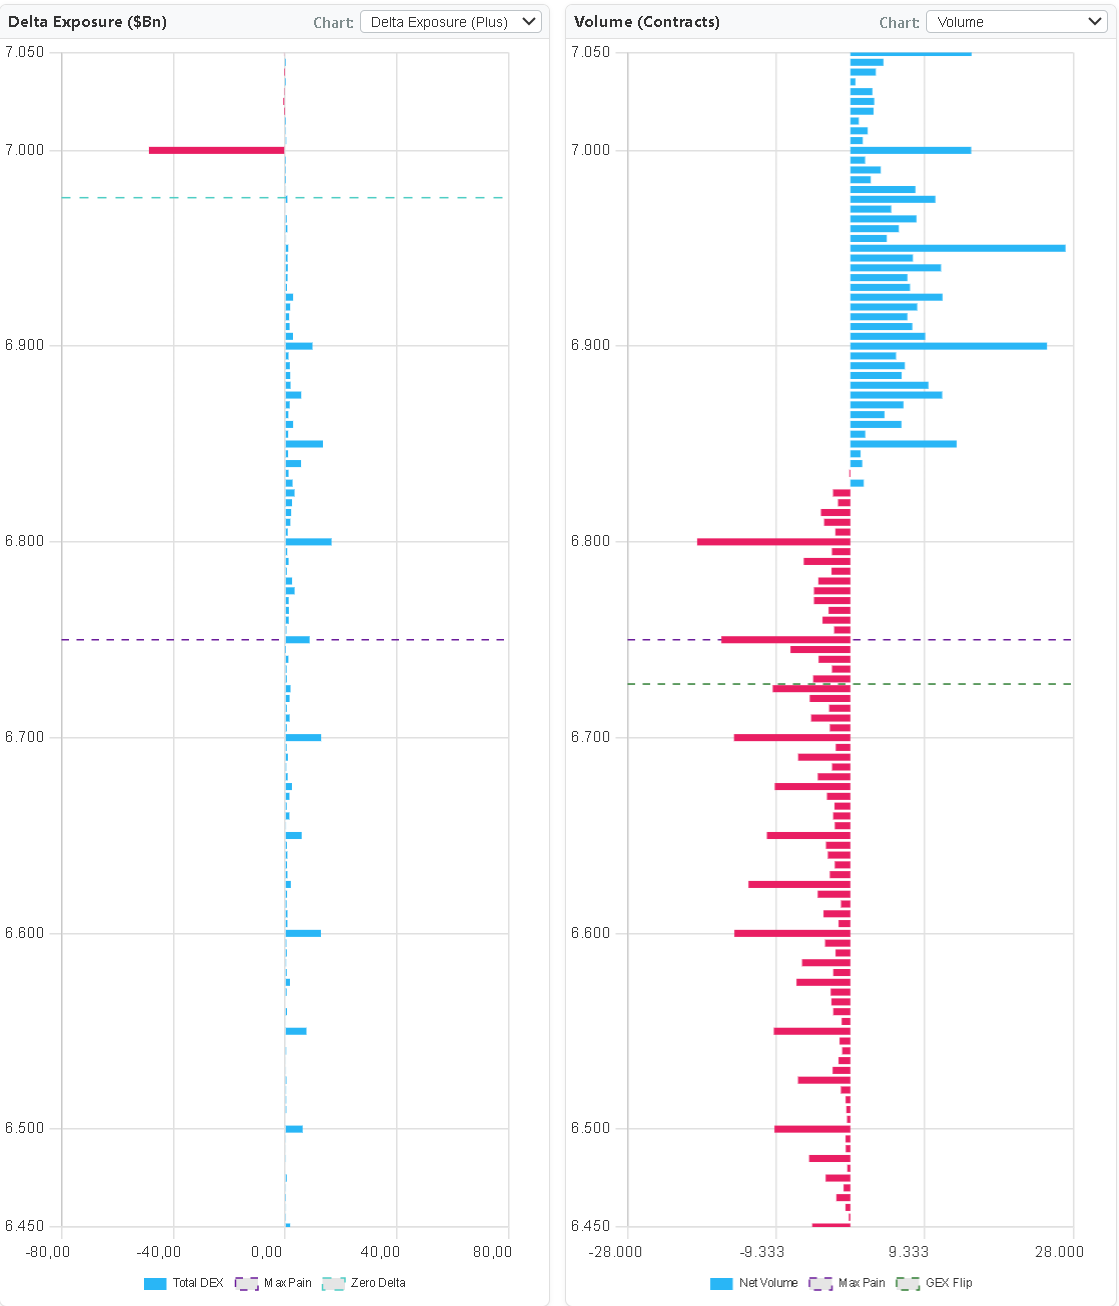
April 15 was VIX options expiration day, two sessions before monthly OPEX. SPX came into the session with a large accumulated negative delta sitting at the 7,000 strike — a position that had been building for weeks, most likely representing market maker or significant institutional activity. SPX was well below 7,000 at the open. Then the market rallied hard.
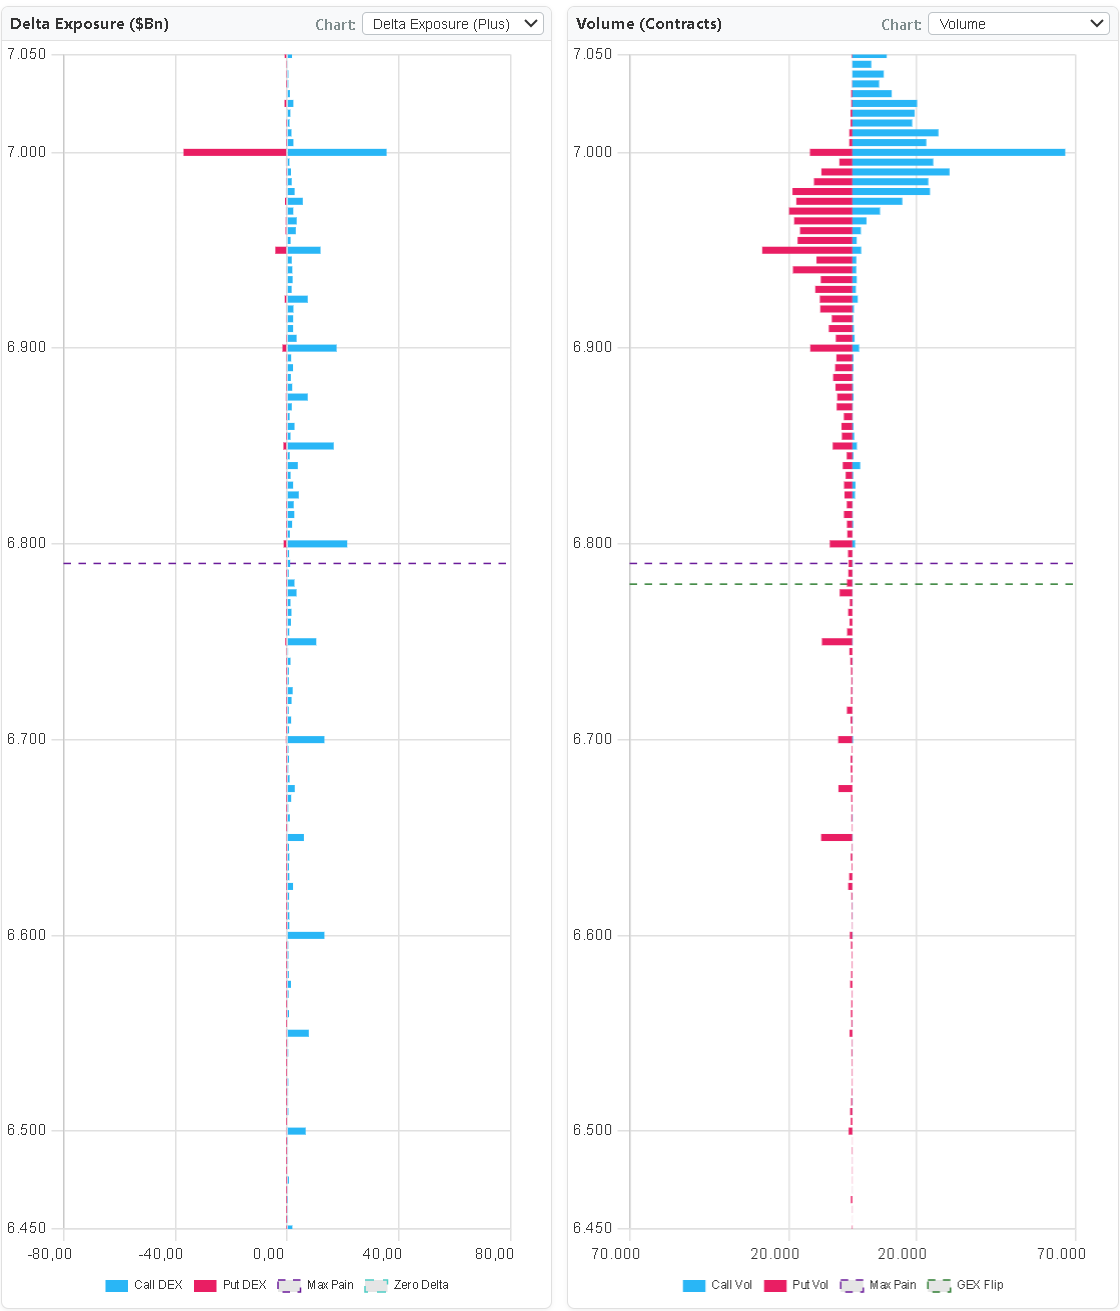
Throughout the entire up move, the massive red bar at 7,000 stayed in place. Dealers were continuously buying the underlying to hedge their short-put exposure as price rose — that mechanical buying was the rally. The negative delta at 7,000 was enormous all morning.
9:30 AM — SPX ~6,985: Red delta at 7,000 already significantly reduced vs the prior day. Dealers had been buying the underlying through the prior session as the strike moved closer to ATM. The remaining red bar represents hedging still ahead.
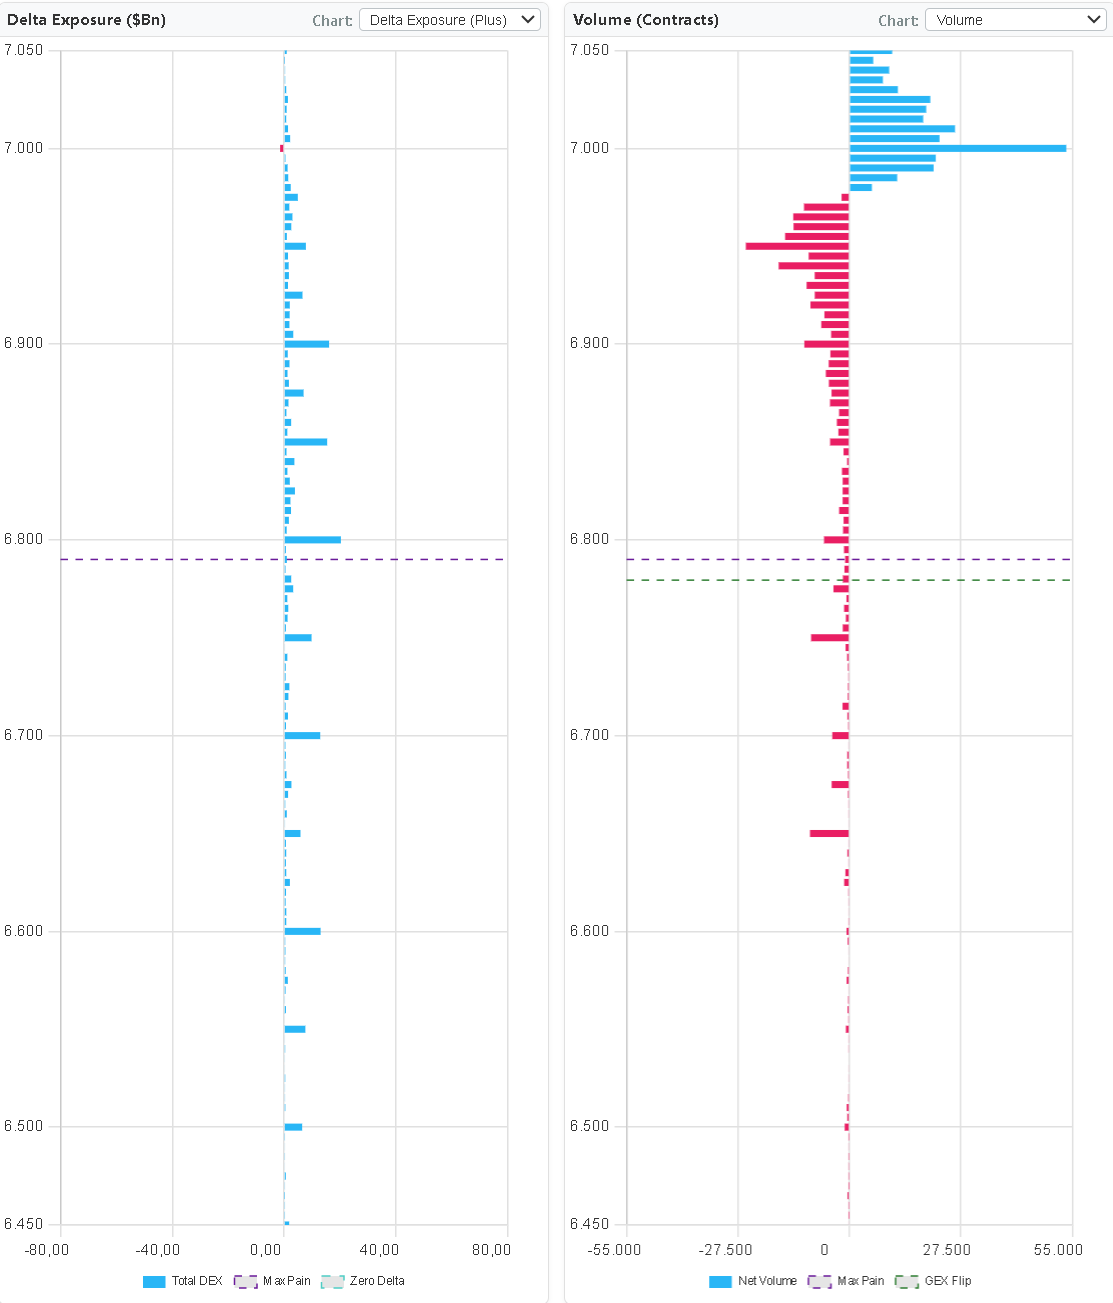
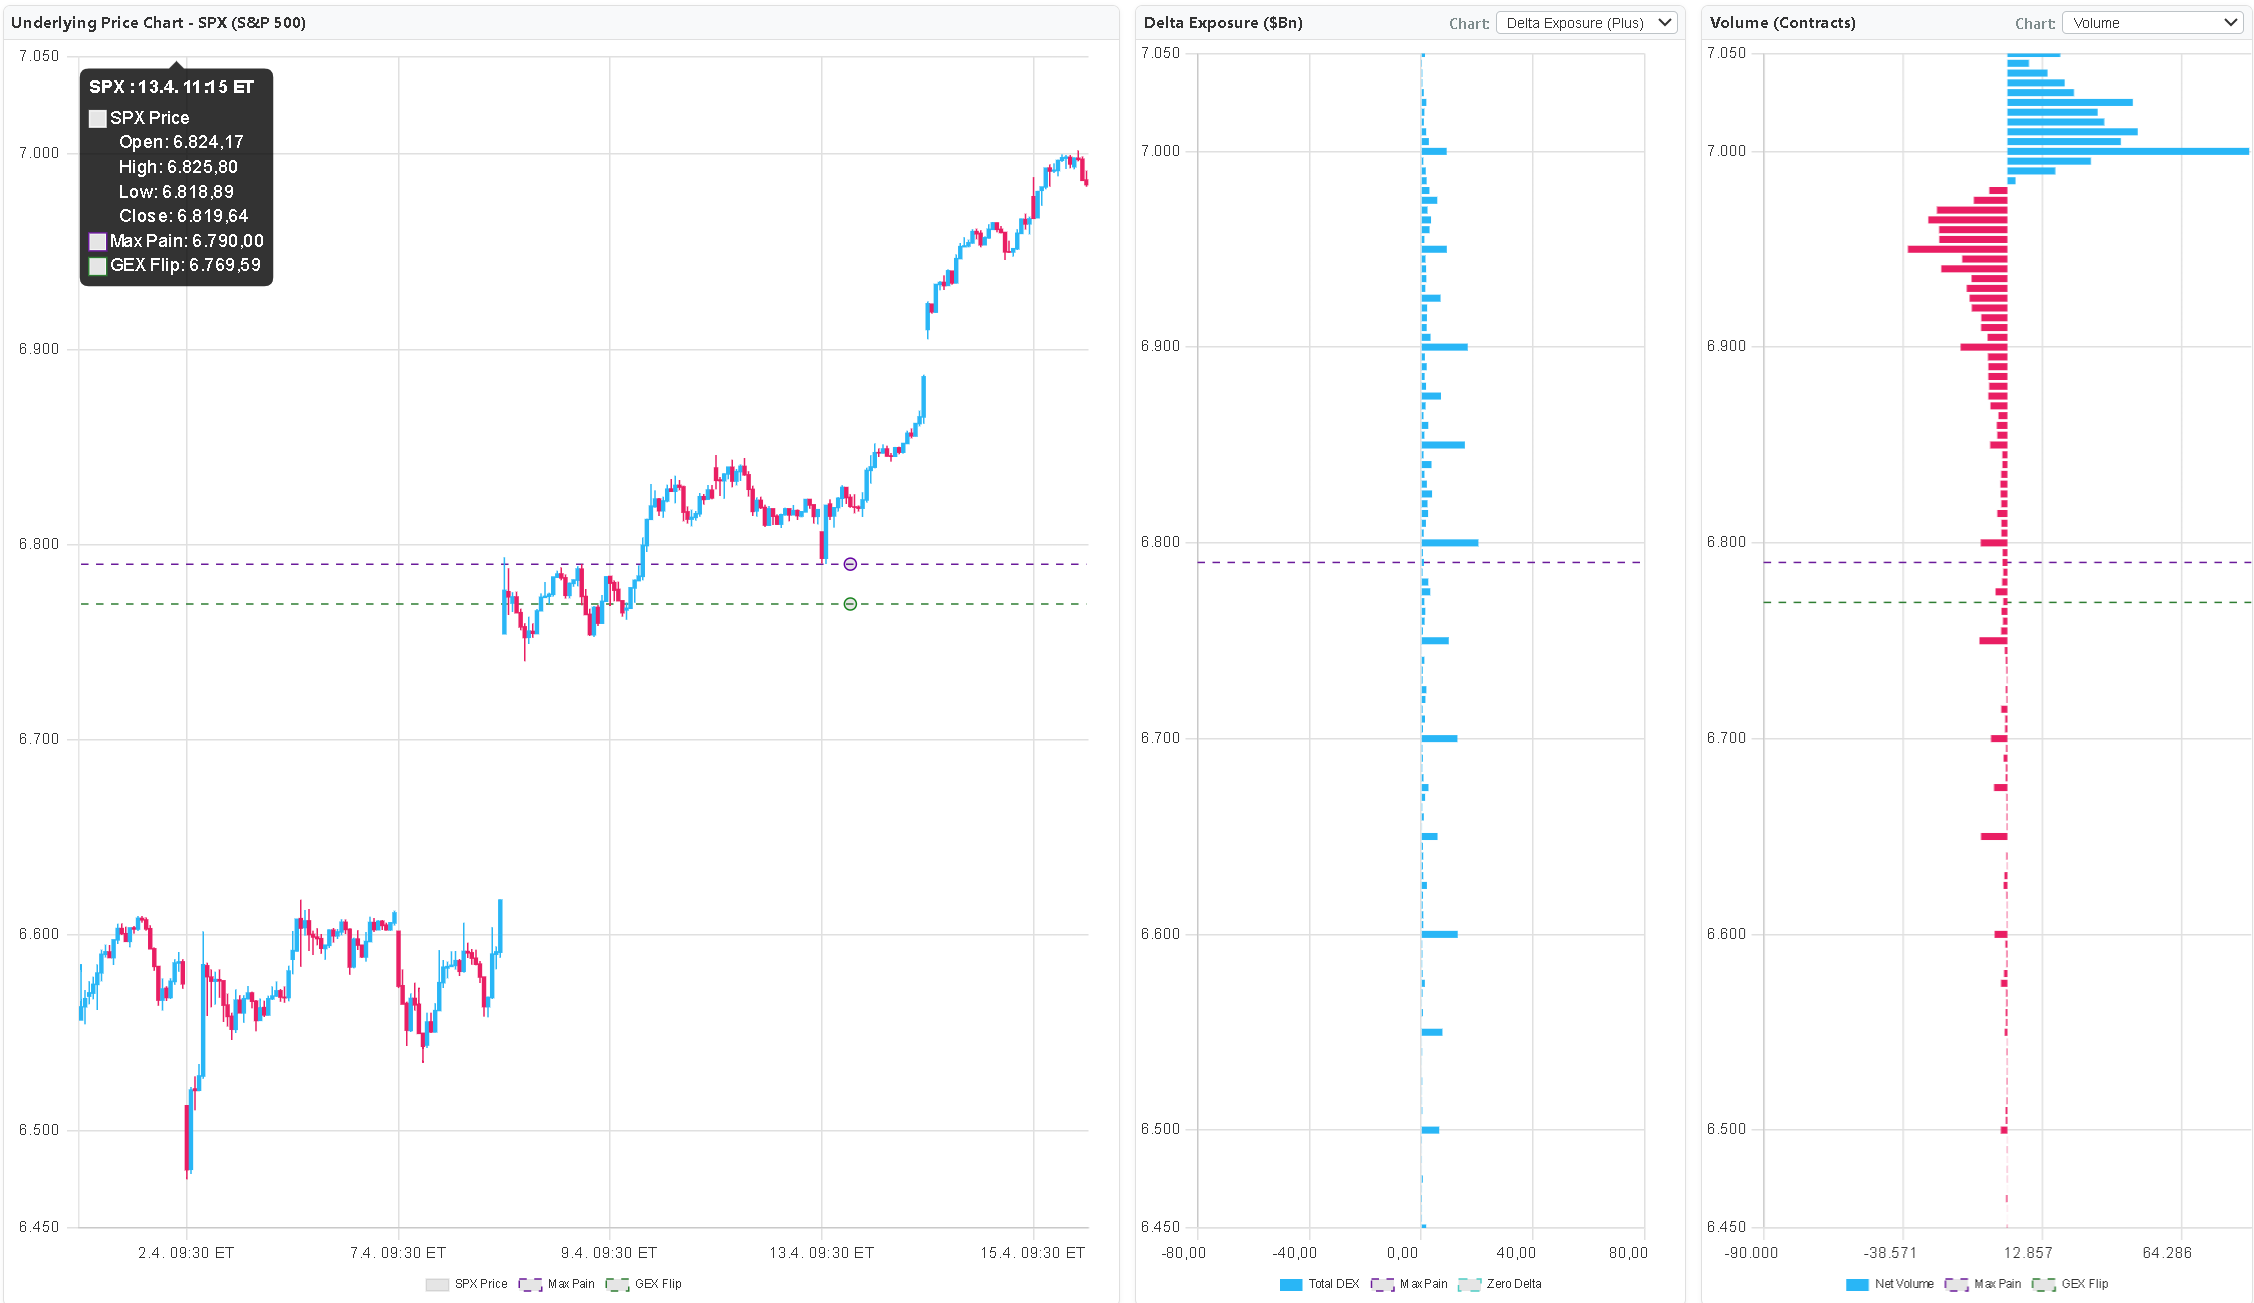
10:30 AM — SPX 6,995: The red bar is now very small. In split view the put-side delta is nearly gone. Something else is happening too — call buying at the 7,000 strike is beginning to offset the remaining put delta. Large players are actively buying calls to neutralize the position, not just passively watching price approach.
11:30 AM — SPX 6,999: The red bar disappears entirely and is replaced by a small blue bar. The net delta at 7,000 has flipped from deeply negative to slightly positive. The structural gravity that had been pulling the market up through dealer buy-hedging is now reversed.
12:00–12:30 PM: The delta flip marks the intraday high. SPX never trades through 7,000. From here, the market turns down for an intraday correction.
The lesson: The buying that drove the rally was dealer delta hedging. Once the hedge was complete and the net position flipped, that mechanical bid disappeared. Price followed. GEX showed the entire process in real time — from the initial large negative delta, through its progressive absorption, to the flip that called the top.
Apr 15 — Morning open, SPX ~6,985. Red delta at 7,000 already reduced vs Apr 14. Dealer buy-hedging through the prior session has consumed a large portion of the position.
Apr 15 — 10:30 AM, SPX 6,995 (net view). Tiny red delta remaining. Call buying at 7,000 is beginning to offset the residual put exposure.
Apr 15 — 10:30 AM, SPX 6,995 (split view). Put-side delta at 7,000 negligible. Call-side activity visible — large players actively buying calls to offset the remaining put exposure.
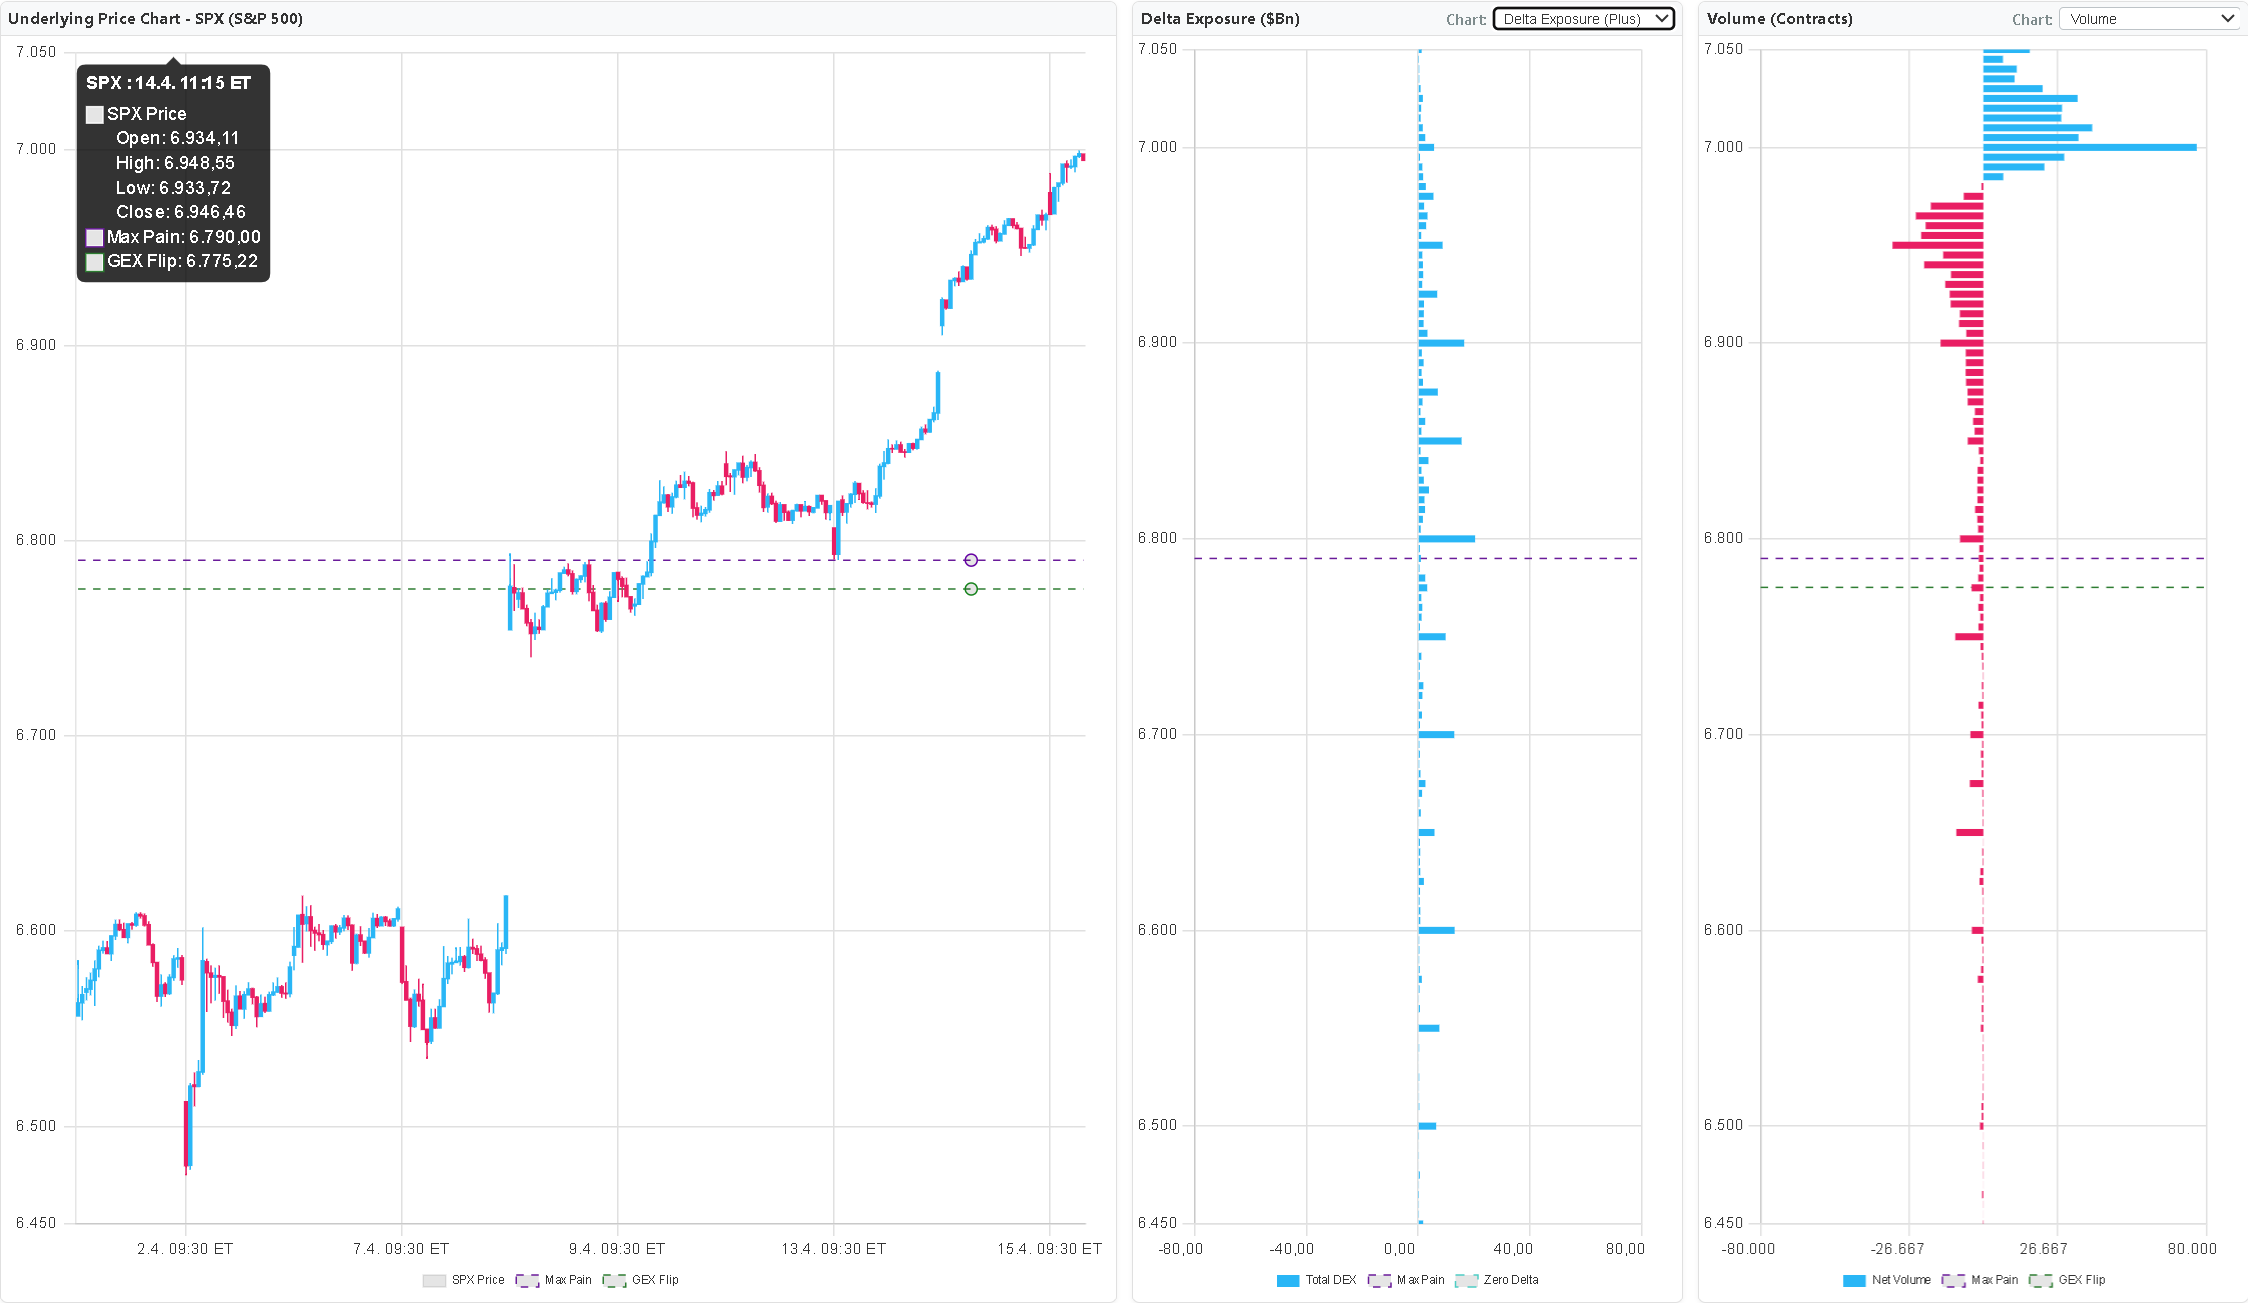
Apr 15 — 11:30 AM, SPX 6,999. The red bar is gone — replaced by a small blue bar. The net delta has flipped. The structural buy force that drove the rally is fully reversed.
Apr 15 — 12:00–12:30 PM. Positive delta at 7,000 confirmed. SPX never breaches the strike. This marks the intraday high — correction follows. The GEX delta flip was the signal.