SPX vs SPY vs XSP Options

All three track the S&P 500 — but they settle differently, scale differently, and attract different participants. Here is which gamma exposure signal is most reliable for each trader type.

See Live SPX & SPY GEX →
Why the Choice of Instrument Changes Your GEX Signal

SPX, SPY, and XSP all move in lockstep with the S&P 500 index. On the surface, this suggests the options on all three should generate equivalent GEX data. In practice, they do not — and using the wrong signal for your strategy is a common source of confusion.

The differences come down to three factors: contract size (and therefore notional scale of dealer hedges), settlement type (cash vs. physical delivery, which changes exercise incentives), and participant mix (retail traders, institutional desks, and portfolio hedgers tend to concentrate in different instruments). Each factor affects how meaningfully the GEX data from that instrument predicts structural price behavior.

If you trade SPX directly, ES futures, or SPY shares, the relevant GEX signal — and the level of reliability you should assign it — differs substantially. This guide breaks down each instrument and explains which traders should be watching which data.

  • SPX options are ~10× larger notional than SPY options — same OI = very different GEX dollar value
  • SPX is European-style and cash-settled — no early assignment risk, no delivery of shares
  • SPY is American-style and physically settled — early exercise is possible, especially pre-dividend
  • XSP is 1/10th the size of SPX, cash-settled — designed for smaller accounts trading SPX mechanics
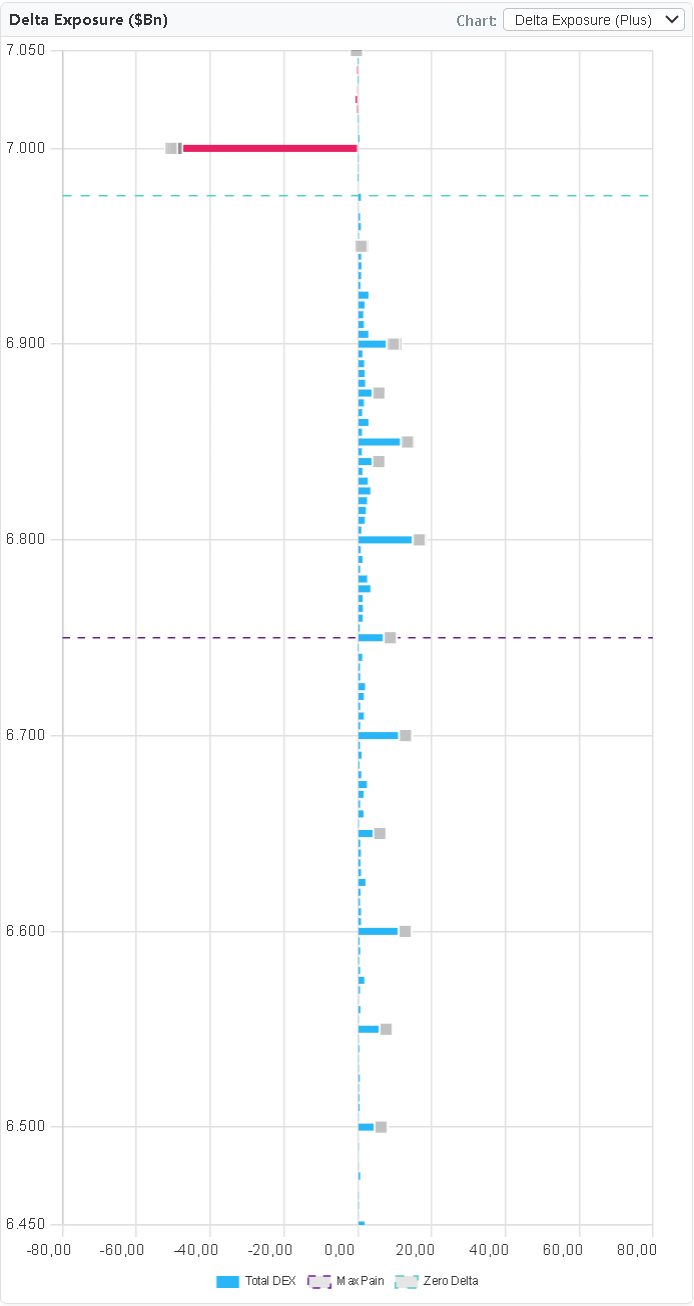
  • SPX generates the most reliable macro GEX signal — it is where institutional positioning lives
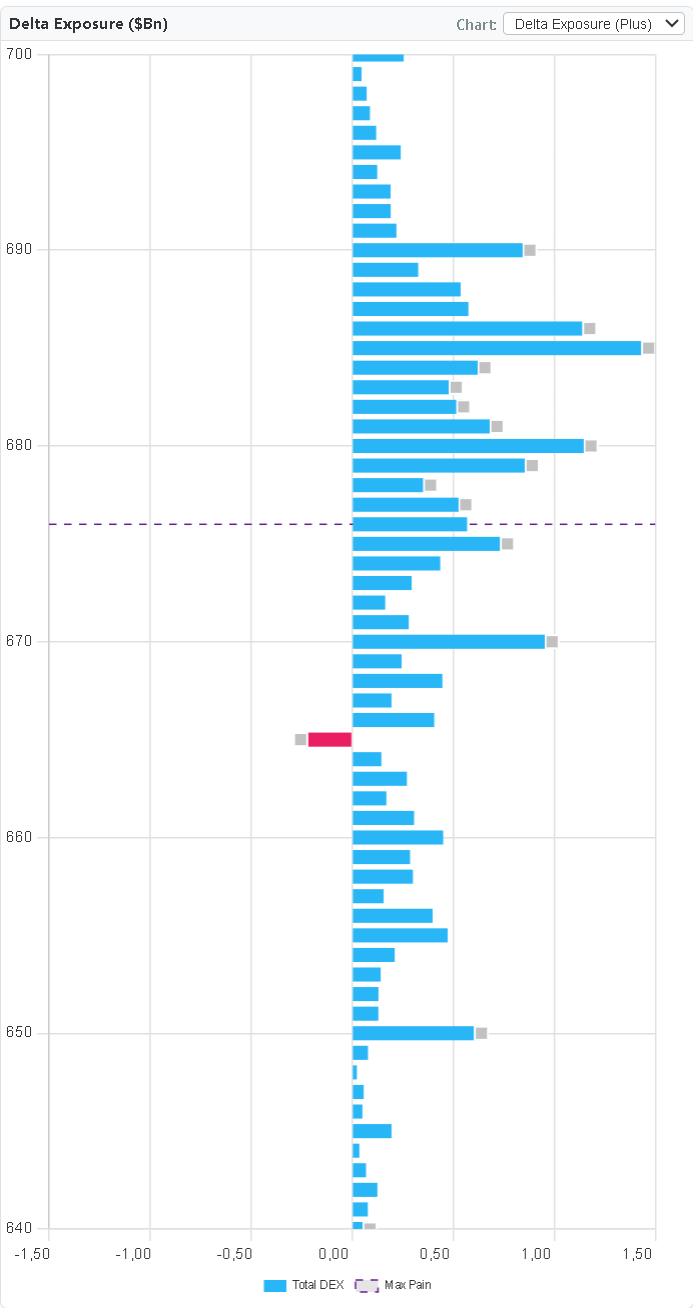
  • SPY GEX adds valuable data on retail and mid-tier institutional hedging not captured in SPX
SPX vs SPY vs XSP — The Key Differences at a Glance
Feature SPX SPY XSP
Underlying S&P 500 Index (~5,700) SPDR SPY ETF (~570) S&P 500 Index, mini (~570)
Contract multiplier $100 per point $100 per point $100 per point
Notional per contract ~$570,000 ~$57,000 ~$57,000
Settlement Cash — no delivery Physical ETF shares Cash — no delivery
Exercise style European (expiry only) American (any time) European (expiry only)
Early assignment risk None Yes — especially before ex-div None
Tax treatment (US) Section 1256 — 60/40 rule Standard capital gains Section 1256 — 60/40 rule
Primary participants Institutional, portfolio hedgers, vol desks Retail, mid-tier institutional, hedgers Retail (SPX mechanics, smaller size)
GEX signal strength Highest — largest notional, cleanest structural levels Moderate — valuable secondary signal Lower — limited by smaller institutional participation

SPX and XSP use the same underlying index but differ in contract size and therefore notional scale of dealer hedges. Both are available on GEX Metrix.

SPX GEX — Why It Is the Benchmark Structural Signal

SPX options are cash-settled, European-style, and trade at roughly 10× the notional of SPY. This combination matters enormously for GEX reliability.

Cash settlement and European exercise mean there is no ambiguity about when or how a position must be closed — it happens at expiration, at the settlement price, and nothing else. This predictability allows institutional desks to hold large positions to expiry with no early-exit risk, which is why SPX OI tends to be much more "sticky" than SPY OI. Sticky OI means the GEX levels derived from it are structurally stable — the Call Wall at 5,800 today is likely to be the Call Wall tomorrow unless a major shift in positioning occurs.

The 10× size multiplier means that GEX in dollar terms — the actual hedging flow that moves the SPX or ES futures market — is dominated by SPX option positioning. An SPX position of 1,000 contracts generates the same notional delta as 10,000 SPY contracts. The dealer hedging from large SPX blocks is therefore visible, concentrated, and structurally meaningful in a way that diffuse SPY positioning often is not.

Who should watch SPX GEX most closely:

  • • ES and MES futures traders — dealer hedges from SPX flow directly into the futures market
  • • SPX directional options traders — understanding where large institutional gamma sits informs when IV spikes or collapses
  • • Swing traders holding SPY or SPXL/SPXS — SPX structural levels work as multi-day support and resistance
  • • Any trader tracking macro structure — the Zero Gamma Level from SPX is the broadest indicator of current market regime
Section 1256 tax benefit: SPX and XSP options (but not SPY) qualify for 60/40 blended capital gains treatment under US tax law — 60% long-term, 40% short-term, regardless of how long the position was held. For active traders this is a meaningful after-tax advantage worth accounting for in instrument selection.
SPY GEX — A Valuable Secondary Signal, Not a Substitute

SPY is the world's most liquid ETF and its options are the most actively traded equity options in absolute contract terms. However, despite this volume, SPY GEX is a secondary structural signal compared to SPX — for two reasons.

First, the American-style exercise feature introduces early assignment risk that makes institutional desks less likely to hold large short-dated SPY option positions through expiration. This results in a different OI profile — more short-term, more frequently rolled — which reduces the persistence of SPY GEX levels relative to SPX. A Call Wall that appears in SPY data is less likely to remain structurally intact for multiple days than the same level in SPX data.

Second, per-contract notional is 10× smaller. The dollar hedging flows generated by SPY dealer positions are therefore a fraction of what SPX positions generate — even when SPY OI is nominally larger in contract count.

Where SPY GEX adds real value:

Confirmation of SPX levels

When SPY GEX shows a key level at the equivalent SPX price (SPY × 10 ≈ SPX), it confirms that the level has significance across participant types — both institutional (SPX) and retail/mid-tier (SPY). Convergence across instruments is a stronger signal than either alone.

Detecting retail-driven regime shifts

Large retail options activity (think meme-stock-era dynamics or unusual pre-event speculation) shows up first and most visibly in SPY GEX before it appears meaningfully in SPX GEX. For traders watching for crowd-driven momentum setups, SPY data can provide earlier warning of a building one-sided flow.

Which Instrument Should You Use? A Practical Decision Guide

There is no universal answer — the right instrument depends on what you trade and what question you are trying to answer with the GEX data.

If you trade ES / MES futures

Track SPX GEX. ES futures price tracks SPX, not SPY. The structural levels that appear in SPX dealer gamma are the same levels the ES market reacts to. SPY GEX is a useful supplement but SPX is the primary signal. Focus on the SPX Zero Gamma Level, Call Wall, and HVL for session planning.

If you trade SPY shares or options

Start with SPX GEX, cross-reference SPY. SPY price is approximately 1/10th SPX, so scale levels directly. SPX GEX will give you the macro structure; SPY GEX adds context about the retail/mid-tier positioning around those levels. When both instruments agree, conviction is higher.

If you trade SPX or XSP options

Track SPX GEX as primary, XSP as a size-accessible check. XSP mirrors SPX mechanics but at 1/10th size — ideal for checking whether the structural levels you see in SPX GEX are reflected at smaller account level. For vol traders and premium sellers specifically, knowing where large gamma sits helps anticipate IV behavior near key strikes.

GEX Metrix tracks SPX, SPY, XSP, and 600+ additional instruments — you can switch between them using the symbol selector on the dashboard.
How GEX Compares Across SPX and SPY — A Visual Reference
What to notice when comparing the two charts:

SPX GEX bars are typically fewer in number but much larger in dollar value — the structural levels stand out clearly with dominant Call Wall and Put Wall bars. SPY GEX shows more distributed positioning across a wider range of strikes, reflecting the broader retail and mid-tier participant mix. When a key level appears prominently in both charts (scaled: SPY strike × 10 ≈ SPX strike), that level has structural significance across participant types and is the higher-conviction trade location.
GEX Metrix SPX Gamma Exposure chart showing institutional-scale call and put gamma distribution by strike

SPX GEX — Apr 14, 9:30 AM. A massive negative delta (red) at the 7,000 strike dominates the chart. This is a large accumulated institutional position — market maker or whale activity — invisible in SPY GEX entirely. SPX was trading well below 7,000 at this point.

GEX Metrix SPY Gamma Exposure chart showing retail and mid-tier gamma distribution by strike

SPY GEX — same time. No equivalent bar near the 700 strike (SPY equivalent of SPX 7,000). A trader watching only SPY would have no idea this structural level existed.

Frequently Asked Questions
Can I combine SPX and SPY GEX data for a stronger signal?
Yes, and many experienced traders do. When you convert SPY levels to their SPX-equivalent (multiply SPY strike by 10), you can overlay the two GEX maps. Strikes where both SPX and SPY show elevated GEX are "doubly confirmed" — they have structural significance across both institutional and retail-scale positioning. Strikes that appear only in one instrument are weaker signals and should be weighted accordingly.
Why does GEX Metrix show SPX GEX instead of "total S&P 500 GEX"?
The instruments are tracked separately because combining them would misrepresent the mechanics. SPX dealer hedges are executed in SPX and ES futures. SPY dealer hedges are executed in SPY shares and sometimes futures. Blending them into a single number would obscure where the actual hedging flow goes. Keeping them separate lets you see which market is carrying the dominant structural positioning — which is almost always SPX for macro-scale analysis.
Is SPY GEX useful at all for understanding macro structure?
Yes — specifically for the weekly and short-dated expiration space. SPY weekly and monthly OI is substantial and generates real dealer hedging flow. The levels in SPY GEX tend to matter most for the 5-day to 30-day time horizon and for instruments that track SPY directly (like many retail ETF portfolios). For intraday and macro structural analysis, SPX remains the cleaner primary signal.
Continue Learning

Now that you understand how GEX data differs across instruments, the next step is understanding how Open Interest — the raw input to GEX — compares to gamma exposure as an analytical tool, and why OI alone can be misleading.

OI vs GEX: The Key Differences → What is GEX? → Live SPX & SPY Dashboard →