OPEX Effects: How Options Expiration Drives Market Impact

Weekly, monthly, and quarterly expirations run the same mechanical cycle at different amplitudes. The full loop, day by day: gamma buildup, expiration day, the reset, and the rebuild.

Track GEX Around OpEx
The calendar most traders ignore

Every few weeks I hear some version of the same complaint: "the market was dead all week, then Monday it just started trending for no reason." Pull up the calendar and the reason is usually sitting right there. Options expired on Friday. The gamma that had been sitting on price like a weighted blanket got removed over a single afternoon, and the market woke up in a different regime.

Expiration does more than close contracts. It forces a cascade of mechanical dealer activity, and because that activity runs on a published calendar, it is one of the few genuinely repeatable structures in this business. The mechanism is simple enough. As options approach expiration, gamma concentrates hard at near-the-money strikes, so small price moves trigger large dealer hedging flows. Layer Charm on top (delta decaying overnight simply because time passed) and you get four recurring effects: pin risk toward high open interest strikes, range compression as extreme positive gamma suppresses volatility into the date, post-OpEx expansion once that stabilizing gamma disappears, and Charm-driven flows at the Thursday and Friday opens that force dealer rebalancing before most people have finished their coffee.

None of this guarantees anything on a given cycle. But the base rates are strong enough that I plan every month around them, and I think you should at least know where you are in the cycle before sizing a position.
The Expiration Hierarchy: Weekly, Monthly, Quarterly

Expirations sit on a calendar hierarchy, and the higher you go, the more open interest settles at once. That matters because the market impact of an expiration scales with the OI that dies on it, not with how many people happen to be trading that day.

At the bottom: daily 0DTE expirations, active every session. Real intraday effects, but confined to a single day's positioning. Then weekly Fridays. Since SPX moved to daily expirations there is nothing special about Friday as a product; it is simply the session where more OI has had time to accumulate, and that accumulation concentrates afternoon gamma near ATM strikes. Pinning to a round number (5400, 5500) in the last two hours is common. Watch any OpEx Friday afternoon and you will see it. Weeklies matter for intraday trading but rarely for multi-day positioning.

Monthly OpEx, the third Friday of each month, is where the heaviest institutional OI concentrates. This is the full-week event: pin risk, Charm flows Thursday morning, vol expansion the week after. And at the top sit the quarterly expirations in March, June, September, and December. That is when index options, index futures, and equity options all expire together. Traders call it triple witching. Same mechanism as monthly, different scale: three months of accumulated OI settling at once, which in my experience makes a quarterly roughly three times a normal monthly in structural impact.

Open interest settling at expiration, relative scale:

Daily (0DTE)
1x baseline
Weekly Friday
1.3 to 1.8x
Monthly (3rd Fri)
2 to 3x
Quarterly (Triple)
5 to 8x

Ballpark relative size of the OI block that dies on each date. Actual values shift with the positioning cycle, so treat these as ordering, not gospel.

One thing this scale does not measure: intraday hedging flow. There the ordering flips. 0DTE contracts now run about 65% of SPX volume, so the gamma dealers are actually trading against during the session is mostly same-day paper (the 0DTE piece covers that side, and the PDT repeal only added fuel). This chart ranks the structural reset when an expiration removes OI from the board, which is a different question.

Mark the dates: triple witching falls on the third Friday of March, June, September, and December. The effects start building the week before, so I put these four dates in the calendar at the start of every quarter and plan sizing around them.
The Four-Phase Cycle

Every major expiration runs the same loop: buildup, expiration, reset, rebuild. Knowing which phase you are in changes how you should read every GEX signal on the screen. Get the phase wrong and you will fade a trend day or chase a pinned market, and both hurt.

Buildup Expiration Reset Rebuild OpEx the cycle repeats
Buildup: the week before, positive gamma compression
In the five to seven trading days before a major expiration, the institutions holding into expiry have mostly settled their positioning. Large blocks of near-ATM OI sit on the board, dealers are net long gamma, and the market leans hard toward mean-reversion. That is why the week before OpEx is historically a low realized volatility, range-bound stretch: the gamma cushion is near its maximum. Fade extremes, sell breakouts, respect the Call Wall and Put Wall.
Expiration day: concentration, pin, final unwind
On the day itself, gamma piles up at ATM strikes as time value collapses. The open (9:30 to 11:00) can move sharply, since any gap forces rapid dealer re-hedging against enormous gamma. The last two hours are the real risk window: pin risk peaks, and dealers have to unwind their delta hedges completely by the close. The final 30 minutes of a quarterly expiration is one of the highest-volume, most mechanically driven sessions of the year, with multi-billion dollar notional flows from index rebalancing on top.
Reset: the Monday after looks like a different market
A large block of OI just died and dealers have flattened their hedges. The GEX picture is now set entirely by the remaining forward OI, which is usually far smaller in dollar terms than what expired. The result is lower positive GEX, sometimes an outright negative gamma regime. Moves run further, trend days show up more often, and the mean-reversion behavior of the prior week simply stops working. In my view this is the single most reliable regime shift on the calendar.
Rebuild: OI accumulates and the blanket comes back
Over the following two to four weeks, institutions roll into the next cycle: buying next-month protection, selling covered calls, rebuilding structured product positions. That accumulation gradually restores positive gamma and compresses volatility back toward the pre-OpEx state. Then it all happens again, with the quarterly version running the same loop at higher amplitude. Knowing your spot in this loop is one of the most durable multi-week frameworks I use.
OpEx Week, Day by Day

Zoom into the expiration week itself and the phases play out on a daily rhythm. This is most pronounced on monthly and quarterly cycles:

Monday
Fresh positioning starts. Last week's expired gamma is gone, structure is loose, and vol can still expand.
Tuesday
GEX for this week's expiration starts building. If VIX moves, Vanna flows kick in. Range still reasonably wide.
Wednesday
Gamma thickens mid-week. Call Wall and Put Wall take shape and the mean-reversion bias strengthens. Keep an eye on VIX for Vanna.
Thursday
Charm flows hit at the open from overnight delta decay. ATM gamma surges, pin risk to the nearest major strike is strong, and the morning move often reverses by the close.
Friday (OpEx)
Maximum ATM gamma, strong pin to the high-OI strike, final Charm unwind at the open. After 3pm the gamma decays into the close and vol can spike in the last 30 minutes.
The Thursday trap: plenty of traders put on directional positions Thursday morning expecting continuation. Charm flows often manufacture a false open-direction move that reverses once the unwind completes by late morning. I wait out the first hour before committing to any directional bias on an OpEx Thursday, and I would suggest you do the same.
Pin Risk: Why Price Gets Stuck at Expiration

Pin risk is the tendency for price to sit glued to a large open interest strike on expiration day. People treat it like a market superstition. It is mechanical, and the mechanics are dealer gamma hedging.

How pinning works

Take a strike at 5500 carrying $2 billion in call OI and $1.5 billion in put OI. As Friday approaches, gamma at 5500 becomes enormous. Price at 5510 drifting down toward 5500? Dealers buy aggressively and support it. Price pushing back up toward 5510? Dealers sell and cap it. Price ends up trapped near 5500 for hours, often right into the close.

A few things sharpen or weaken the pin. It is strongest at round numbers (5400, 5500, 5600 on SPX) and strongest when a single strike dominates OI on both the call and put side. Monthly pins are more reliable than weekly ones, simply because the OI behind them is bigger. And the pin can absolutely break: give the market a real directional catalyst, or thin enough liquidity, and dealers get overwhelmed like anyone else.

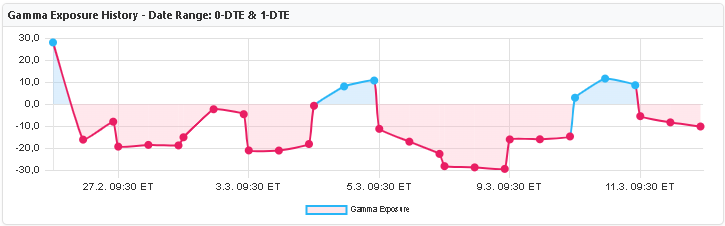
GEX Metrix Gamma Exposure History chart showing persistent negative gamma over the OPEX period with blue line crossing zero

Here is what this looked like on our Gamma Exposure History chart (0-DTE and 1-DTE range). The pink shading marks persistent negative gamma through the OPEX period, which lines up with the trending, volatile tape we saw in February and March. The occasional blue spikes above zero were brief positive gamma windows, and those were the range-bound days. I treat this chart as the OPEX regime scorecard.

Post-OpEx Volatility Expansion

Once the options expire, the gamma that had been compressing volatility all week is simply gone. The market wakes up with lower aggregate GEX, and lower GEX means less dealer stabilization.

Why the week after OpEx runs hot

The expired OI gets replaced by fresh positioning, but that rebuild takes days and usually carries lower aggregate gamma at first. So for the first few sessions after OpEx the market operates with a thin cushion. Price moves more freely. Trend days are more common. Monday and Tuesday after expiration are often the highest-volatility days of the whole cycle, and post-quarterly expansion typically beats post-monthly.

The practical consequence: strategy weighting should flip. Momentum and breakout approaches tend to outperform mean-reversion in the first two or three days post-OpEx, then the edge fades as new OI rebuilds the gamma structure through the following week.

A check worth doing: compare total GEX on the Friday close against the Monday after. A sharp drop in aggregate GEX confirms the low-structure environment. That is my cue to lean momentum and back off the fades.
Quarterly OpEx: Different in Degree, Same in Kind

Nothing about triple witching requires a new mental model. Everything above still applies, just louder. Three months of OI instead of one, futures rolls adding their own mechanical layer, and quarter-end window dressing running in parallel.

The week before a quarterly often shows the most sustained positive-gamma compression of the entire quarter. SPX realized vol in that window has historically run below its trailing 30-day average more consistently than any comparable stretch. Then the coin flips: the first full week of the new quarter is one of the highest-volatility windows on the calendar, because the gamma structure resets to its lowest level of the year.

Two quarterly-specific wrinkles worth knowing. The futures roll (usually Tuesday through Thursday before expiry) can temporarily distort GEX readings, so check which expiration month actually drives the dominant OI before trusting a level. And quarter-end rebalancing adds a flow layer that has nothing to do with options; the GEX levels still describe the dealer hedging component, but they will not capture a pension fund rotating $20 billion of equity into bonds.

My quarterly OpEx routine:

Mark the date at the start of the quarter. Week before: high positive gamma, so range trade and sell extremes. The day itself: expect a fast post-open move, then pin dynamics into the close, and keep size small. Week after: expect lower GEX, widen stops, favor momentum over mean-reversion until the OI rebuild shows up in the data.
Everything runs hotter: around a quarterly, expect each of these effects at roughly 2 to 3 times normal monthly intensity. Stronger pin, bigger post-OpEx expansion, more extreme Thursday Charm flows. Cut size in the surrounding days. The market will still be there the following week.
Quick Reference: What I Lean On in Each Phase

Condensing all of the above into one table. This is a bias map, not a system:

Phase Market Character Strategy Lean
Mon-Tue OpEx week GEX building, moderate range Neutral, wait for structure
Wed OpEx week Strong Call/Put Walls forming Mean-reversion at the walls
Thursday Charm flows plus extreme pin gamma Fade the open, watch the pin
OpEx Friday Pin risk, gamma collapse at close Minimal size, pin trade or flat
Post-OpEx Mon-Tue Low GEX, vol expansion Momentum, breakout strategies

People sometimes ask whether they should just avoid trading during OpEx week. I'd argue the opposite. The buildup phase is often the most tradeable stretch of the month, because that is when the GEX structure is cleanest and the walls act as high-confidence fade zones. What changes across the cycle is which strategy deserves the weight, and the whole point of watching the calendar is to make that switch on time instead of a week late. These same dealer mechanics run at smaller scale every session; the 0DTE flow article covers the daily version.