Same index, different signal
A question I get more than almost any other: "SPX and SPY track the same thing, so why do the GEX charts look different?" It is a fair question. The honest answer is that the charts should look different because the positioning behind them belongs to different people doing different things.
The gap comes down to three factors. Contract size first: one SPX contract carries roughly 10 times the notional of one SPY contract, so identical open interest numbers translate into wildly different dollar-value gamma. Settlement second: SPX is cash-settled and European-style, SPY is physically settled and American-style, and that changes how long people are willing to hold positions. And participant mix third. Institutional desks, portfolio hedgers, and vol traders concentrate in SPX. Retail and mid-tier flow lives more in SPY. XSP sits in between, giving smaller accounts SPX mechanics at a tenth of the size.
So if you trade ES futures, SPY shares, or SPX options directly, the GEX signal you should be watching (and how much weight to give it) differs quite a bit. That is what this piece works through.
The differences at a glance
| Feature | SPX | SPY | XSP |
|---|---|---|---|
| Underlying | S&P 500 Index (~5,700) | SPDR SPY ETF (~570) | S&P 500 Index, mini (~570) |
| Contract multiplier | $100 per point | $100 per point | $100 per point |
| Notional per contract | ~$570,000 | ~$57,000 | ~$57,000 |
| Settlement | Cash, no delivery | Physical ETF shares | Cash, no delivery |
| Exercise style | European (expiry only) | American (any time) | European (expiry only) |
| Early assignment risk | None | Yes, especially before ex-div | None |
| Tax treatment (US) | Section 1256, 60/40 rule | Standard capital gains | Section 1256, 60/40 rule |
| Primary participants | Institutional, portfolio hedgers, vol desks | Retail, mid-tier institutional, hedgers | Retail (SPX mechanics, smaller size) |
| GEX signal strength | Highest: largest notional, cleanest structural levels | Moderate: valuable secondary signal | Lower: limited by smaller institutional participation |
Why SPX is the benchmark
SPX options are cash-settled, European-style, and trade at roughly 10 times the notional of SPY. That combination matters more for GEX reliability than most people appreciate.
Cash settlement and European exercise remove all ambiguity about when a position closes: at expiration, at the settlement price, and never earlier. Desks can hold large positions to expiry without worrying about someone exercising against them. In my experience this is exactly why SPX open interest is so "sticky" compared to SPY.
Sticky OI means stable levels. The Call Wall at 5,800 today is very likely still the Call Wall tomorrow, unless positioning genuinely shifts.
The 10x size multiplier does the rest. GEX in dollar terms, the actual hedging flow that pushes SPX and ES futures around, is dominated by SPX option positioning. A thousand SPX contracts generate the same notional delta as ten thousand SPY contracts. When a big SPX block goes up, the resulting dealer hedge is visible, concentrated, and structurally meaningful. Diffuse SPY positioning often isn't.
ES and MES futures traders, because dealer hedges from SPX flow straight into the futures market. SPX directional options traders, since knowing where large institutional gamma sits tells you a lot about when IV spikes or collapses. Swing traders holding SPY or the leveraged SPXL/SPXS products, because SPX structural levels tend to hold as multi-day support and resistance. And really anyone tracking macro structure at all: the Zero Gamma Level from SPX is the broadest single read on the current market regime.
SPX and XSP options (but not SPY) qualify for Section 1256 treatment under US tax law, meaning gains are taxed 60% long-term and 40% short-term regardless of holding period. For active traders that is a meaningful after-tax edge, and it is worth factoring into instrument choice before you ever look at a GEX chart.
SPY: a useful second opinion
SPY is the most liquid ETF in the world, and its options trade more contracts than anything else in the equity space. You would think that volume would make SPY GEX the definitive signal. It doesn't, for two reasons.
First, American-style exercise creates early assignment risk, and desks respond to it by avoiding large short-dated SPY positions held through expiration. The resulting OI profile is shorter-term and rolled more frequently, so SPY GEX levels simply do not persist the way SPX levels do. A Call Wall in SPY data is less likely to still be there in three days than the equivalent level in SPX.
Second, each contract carries a tenth of the notional. Even when SPY OI is nominally larger in raw contract count, the dollar hedging flow it generates is a fraction of what SPX positioning produces.
Where SPY GEX genuinely earns its keep:
Confirming SPX levels
When SPY GEX shows a key level at the equivalent SPX price (SPY strike times 10, roughly), you know that level matters to both institutional and retail-scale positioning. Convergence across the two instruments is a stronger signal than either chart alone.
Catching retail-driven shifts early
Big retail options activity, think meme-stock-era dynamics or unusual pre-event speculation, shows up first and most visibly in SPY before it registers meaningfully in SPX. If you watch for crowd-driven momentum setups, SPY data is your early warning of a building one-sided flow.
What I would watch, depending on what you trade
There is no single right answer here. The right data depends on what you actually trade and what question you are asking of it.
If you trade ES or MES futures, track SPX GEX and don't overthink it.
ES prices off SPX, not SPY, and the structural levels in SPX dealer gamma are the same levels the futures market reacts to. The SPX Zero Gamma Level, Call Wall, and HVL are the ones I would build a session plan around. SPY GEX is a supplement, nothing more.
If you trade SPY shares or SPY options, start with SPX GEX anyway and cross-reference SPY. SPY trades at roughly a tenth of the index, so the levels scale directly. SPX gives you the macro structure; SPY adds context about retail and mid-tier positioning around those levels. When both charts agree, conviction goes up. When they disagree, I would trust SPX for structure and treat the SPY divergence as information about crowd behavior.
And if you trade SPX or XSP options themselves, SPX GEX is your primary map, with XSP as a size-accessible check. XSP mirrors SPX mechanics exactly but at a tenth of the size, which makes it useful for seeing whether the structural levels in SPX carry through at smaller-account scale. For vol traders and premium sellers in particular, knowing where the large gamma sits is half the battle in anticipating IV behavior near key strikes.
One chart that makes the whole argument
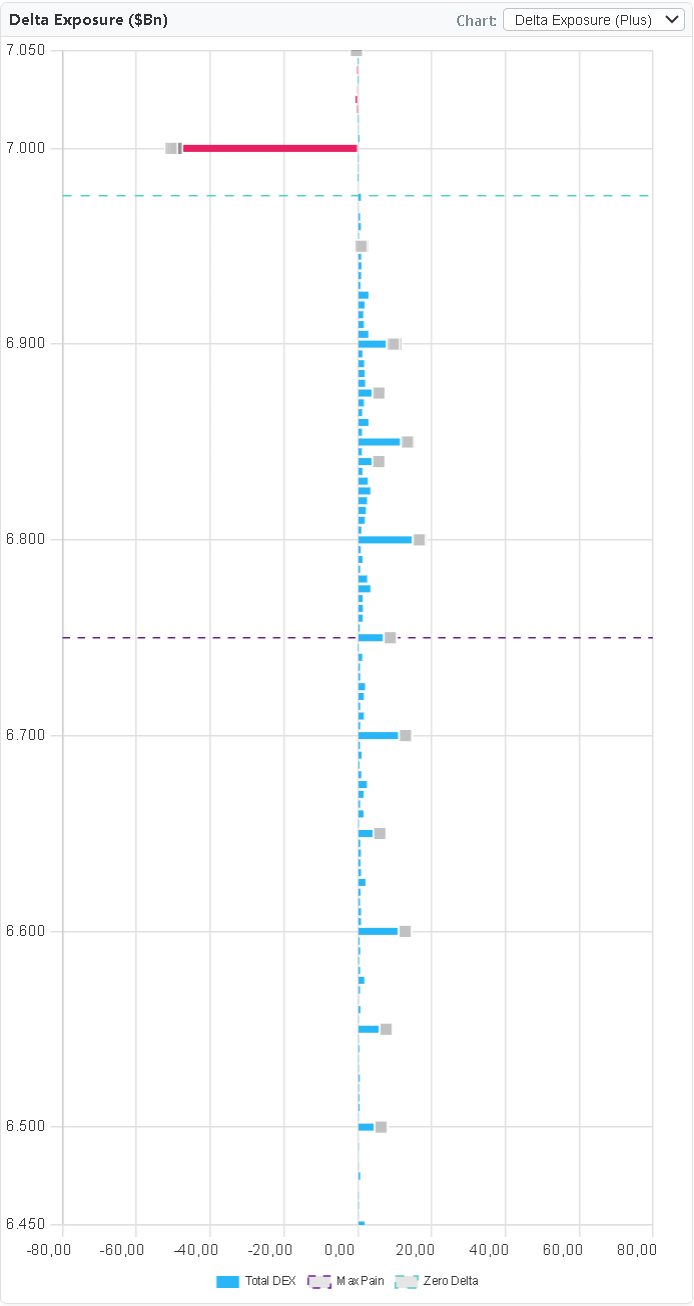
The pattern is consistent whenever you put the two side by side. SPX GEX shows fewer bars, but each one is much larger in dollar value. The structural levels jump out: a dominant Call Wall, a dominant Put Wall, not much noise between. SPY GEX spreads positioning across a wider band of strikes, which is exactly what you would expect from a broader retail and mid-tier crowd. When a level shows up prominently in both (scaled by 10), that is the higher-conviction location.
But sometimes the divergence is the story. Here is an example from our SPX chart.
Two questions I keep getting
Can I combine SPX and SPY GEX data for a stronger signal?
Yes, and I would encourage it. Multiply SPY strikes by 10 and you can overlay the two maps directly. Strikes where both instruments show elevated GEX are doubly confirmed, meaning they matter to institutional and retail-scale positioning at the same time. Strikes that appear in only one chart are weaker signals, and I would weight them accordingly rather than throwing them out.
Why show SPX and SPY separately instead of one combined "total S&P 500 GEX" number?
Because blending them would misrepresent the mechanics. SPX dealer hedges get executed in SPX and ES futures. SPY dealer hedges get executed in SPY shares, sometimes futures. Mash the two together and you lose sight of where the actual hedging flow goes. Keeping them separate lets you see which market carries the dominant structural positioning, and for macro-scale analysis that is almost always SPX.
Where to go next
The natural follow-up is understanding open interest itself, the raw input behind every GEX number, and why OI on its own can mislead you. I wrote up the comparison in OI vs GEX: The Key Differences, and if you are newer to all of this, What is GEX? is the place to start.
OI vs GEX: The Key Differences What is GEX?