Some days SPX behaves like it is on rails. Every dip into a certain strike gets bought, every push above another strike gets sold, and by the close the index has gone nowhere. Other days the exact same chart turns into a runaway train, and every technical level you drew gets steamrolled before lunch. For years I assumed that was just "the market being the market." It mostly isn't. A large share of that behavior is dealer hedging, and gamma exposure is how you measure it.
Gamma Exposure, or GEX, is the total gamma that options market makers (the dealers who take the other side of most options trades) carry across all active strikes and expirations. In dollar terms, it tells you how much the collective delta of all dealer positions changes for every 1% move in the underlying price.
Why does that number matter to anyone who is not a dealer? Because of what it forces dealers to do. Market makers do not speculate on direction. They sell options, collect the spread, and hedge the resulting delta continuously to stay neutral. When gamma is concentrated at a strike, even a small move toward that level requires a rebalance. That means firing off large buy or sell orders in SPX, ES futures, or SPY. There is no committee meeting about it. The hedge follows the math, on every tick, whether the dealer likes the market or not.
The whole edge in one sentence: predictable, structural buying and selling pressure at levels you can identify before the session opens.
× Open Interest
× Contract Size (100)
× Spot Price²
× 0.01
Total GEX is just the sum across every strike. If the total comes out positive, dealers are net long gamma. If it comes out negative, they are net short. That single sign determines which of two very different markets you are trading in, and it changes what a sensible trade even looks like.
A note on the spot-squared term, because people ask: it converts gamma from "delta change per point" into dollar notional per 1% move. Without it, you could not compare GEX across instruments trading at different price levels. With it, a GEX figure on SPX and a GEX figure on NDX mean the same thing.
The options market outgrew the stock market
GEX was not always worth tracking. Fifteen years ago, dealer hedging was a rounding error next to ordinary equity flow, and you could trade index futures for a whole career without ever thinking about it. That stopped being true, and the numbers tell you when and by how much.
Options activity grew roughly five times faster than the thing it is written on. And the expiring delta notional is directional exposure that dealers have to unwind or rehedge as the day unfolds, not premium changing hands. No other single instrument concentrates this much structured hedging flow.
So the practical takeaway is blunt. Trade SPX, ES, NQ, or any US index product and you are already trading against dealer hedging flows every single day. The only question is whether you can see them. And you do not need to touch an options contract to benefit; the flows land in the underlying, which means they land on your futures chart whether you asked for them or not.
Why the hedging is mechanical, with a worked example
People hear "dealers are forced to buy" and reasonably suspect marketing language. So walk through one position and judge for yourself.
A dealer sells 1,000 SPX calls at the 5,800 strike with a delta of 0.40. His book is now short the equivalent of 40,000 SPX deltas (1,000 contracts, 100 multiplier, 0.40 delta each). So he buys that much exposure in ES futures and goes home flat. Fine. But delta does not sit still. Gamma is the rate at which delta changes, and if SPX rallies 20 points toward the strike, that 0.40 delta might become 0.48. The dealer is suddenly short 48,000 deltas against a 40,000 hedge, so he must buy another 8,000 deltas of exposure. Right now, into a rising market, at whatever price is offered. If price falls back, delta shrinks and he sells the excess.
He never once formed an opinion about the market.
Now multiply that single position by every strike and every expiration on the board, and net it all out. That net number is GEX. Where it is large, the rebalancing orders are large. And because thousands of positions concentrate at the same round strikes, the flows concentrate too. This is why I call the resulting levels structural rather than technical: they exist because of positions that must be hedged, not because a pattern happened to repeat.
Two regimes, nearly opposite playbooks
The sign of total GEX is the single most useful output of the whole exercise. It defines the regime you are trading in, and in my experience the correct approach in one regime will actively lose money in the other.
Positive Gamma
- Price drops, dealers must buy the underlying to rehedge. That is support.
- Price rises, dealers must sell to rehedge. That is resistance.
- Net effect: every move gets pulled back toward equilibrium.
- The tape: range-bound, compressed volatility, mean-reverting intraday.
- How I lean: fade extremes, distrust breakouts that lack volume, target range midpoints.
Negative Gamma
- Price drops, dealers must sell to rehedge. The decline accelerates.
- Price rises, dealers must buy. The rally accelerates.
- Net effect: dealer activity amplifies moves instead of damping them.
- The tape: trending, volatile, momentum-driven.
- How I lean: follow momentum, widen stops, and stop trying to pick tops and bottoms.
The mechanism behind both columns is identical, which is what makes this satisfying rather than mystical. A dealer who is long gamma gets longer as price falls and shorter as price rises, so his hedge always trades against the move. A dealer who is short gamma has the opposite problem: his hedge chases the move, and the chase feeds the move. Same math, flipped sign, completely different market.
You have watched negative gamma in action even if you never called it that. The August 5, 2024 vol spike is a clean recent example: once the market fell through the zone where dealer gamma flipped negative, the selling begot hedging that begot more selling. The move ran far beyond what the overnight news alone justified. February 2018 played out the same way with the short-vol complex attached. I am not claiming GEX predicted either event. What it does is tell you, in advance, at what price the market's shock absorbers turn into accelerants.
SPX has historically closed inside the band between the Put Wall and Call Wall in roughly three out of four sessions, and our own levels are computed on the same principles. That is a base rate most technical setups would kill for, and most experienced GEX users set their entire directional bias before the open based on whether price sits above or below the Zero Gamma Level.
What GEX looks like across strikes
A GEX chart puts a horizontal bar at each strike showing how much gamma is parked there. Green bars are positive gamma (dealers stabilize price near them). Red bars are negative gamma (dealers amplify moves near them). The biggest bars are your structural levels for the session. A simplified sketch:
The four levels, briefly
Four structural levels fall straight out of the GEX calculation. Nobody draws them by hand and they owe nothing to past price action; they mark where dealer gamma is concentrated right now. I will keep this short because the full level-by-level walkthrough, with dashboard screenshots and trade scenarios, lives in the GEX reference guide.
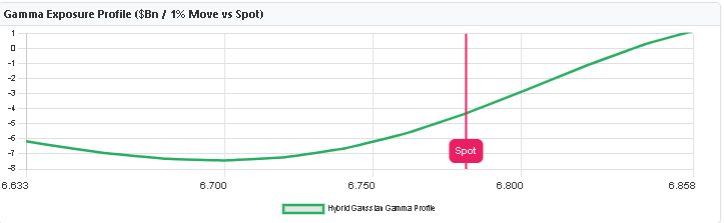
Zero Gamma Level (Gamma Flip)
Where total dealer gamma crosses from positive to negative. Above it you are in the stabilizing regime, below it the amplifying one. If you only track one level, track this.
Call Wall
The strike with the heaviest positive call gamma. Dealer selling into any approach makes it mechanical resistance, and in positive gamma it often caps the day's range.
Put Wall
The strike with the heaviest put gamma. Dealer buying into a test can produce sharp bounces, though how the level behaves depends on which side of zero gamma it sits.
High Volatility Level (HVL)
The threshold beyond which hedging is projected to accelerate moves rather than absorb them. Futures traders lean on a confirmed HVL break to distinguish a trend day from a probe.
The stale-data objection
The most common objection I hear about GEX: it is calculated from yesterday's closing Open Interest, so surely it is obsolete an hour into the session. Fair question. Wrong conclusion, most days.
Open Interest reflects the aggregate positioning of institutional options traders: the large funds, banks, and structured product desks that drive the bulk of notional options volume. Those positions do not flip intraday. A pension fund's collar and a bank's structured note hedge are still sitting there at 2 PM. Unless a genuinely large catalyst generates extraordinary volume relative to existing OI, yesterday's close remains the dominant structural force behind the day's dealer hedging.
Which is why the levels you mark before the open (Call Wall, Zero Gamma, Put Wall) usually keep acting as magnets and barriers all session even as the exact dollar figures drift a little while new intraday positions accumulate.
Overnight OI is the structural map of where institutional money sits. Intraday volume adds noise around that structure, but the architecture underneath rarely changes before the close. The levels hold because the positions behind them hold.
The exception is the high-volume catalyst day: Fed decisions, surprise macro prints, the occasional mega-cap earnings shock. On those days I treat the levels as guides rather than hard lines and demand tighter confirmation before acting on any of them.
If you want to go deeper on the staleness problem itself, and what can actually be done about it, that is covered in the intraday OI piece.
My pre-session routine, in three steps
The traders who get real value out of GEX are not the ones checking it mid-session and reacting. They are the ones using it before the open to build a scenario plan, so the mid-session decision is execution rather than analysis. The version I run takes about five minutes.
Identify the regime
Before anything else, note whether SPX (or wherever ES is trading pre-open) sits above or below the Zero Gamma Level. Above means range-day tendency, sell extremes. Below means trend-day tendency, follow momentum. One data point, one clear starting bias.
Mark the structural levels
Put the Call Wall, Put Wall, and HVL on your chart. These are the session's high-probability reaction zones. Plan entries, stops, and targets around them before the bell. Knowing 5,800 is the Call Wall means you already have a hypothesis about what happens if ES gets there. You are not guessing in the moment, and that changes how you trade the moment.
Build both scenarios
Write down one plan per regime: a range-day scenario where price bounces between the Put Wall and Call Wall, and a breakout scenario where price takes out the HVL and total gamma flips negative. The market usually declares which script it is running inside the first 30 to 60 minutes. Your job at that point is just to follow the plan you already wrote.
Two questions I get constantly
Do I need to trade options to use GEX data?
No, and I would argue this is the most underappreciated part of the whole subject. GEX describes what market makers are forced to do in the underlying (SPX, ES, SPY, NQ) rather than in the options market itself. Anyone trading ES futures or any major index product sees dealer hedging show up on the chart as structural support, resistance, and momentum zones whether they have ever bought an option or not. Directional traders, scalpers, and swing traders all use the levels the same way: to know where large mechanical buying and selling pressure is waiting before the session starts.
How often do the levels change?
Slower than you would think, most of the time. The major structural levels (Call Wall, Put Wall, Zero Gamma) are driven by institutional OI that turns over gradually. On a typical day they stay fairly stable. The big exception is expiration. After monthly and especially quarterly OpEx, large blocks of OI vanish at once. Dealers unwind the hedges attached to them and the entire GEX picture can reset. That post-OpEx reset is one of the most common triggers for a regime change, and it is covered in detail in the OPEX effects article.
This piece is deliberately the theory half. The chart walkthrough lives in the GEX reference guide. There I go through the dashboard screen by screen: the four levels in full, an interactive hedging simulator, and three concrete trade scenarios. If 0DTE flow is your thing, the same-day gamma dynamics get their own treatment too.
Run the Three-Step Routine Before Tomorrow's Open
Load the live SPX GEX data, find the Zero Gamma Level, mark the walls, and build both scenarios yourself. The core view is free.
Open the Free GEX Dashboard GEX Reference Guide