0DTE Options and Gamma: What Actually Happens Every Session

Same-day expirations now run roughly 60% of SPX options volume. How that gamma behaves through the trading day, and where the media story parts ways with the data.

Track 0DTE GEX
The 2pm move nobody can explain

Every futures trader has lived this one. Quiet tape, no news on the calendar, and then ES rips 30 points in fifteen minutes for no visible reason. The usual suspects get blamed: algos, "smart money", someone who knew something. In my experience, most of these moves have a much more boring explanation. Somebody's option book crossed a strike, and the dealers on the other side had to hedge. Fast.

The instrument doing most of that work today is the zero-days-to-expiry option. A 0DTE contract expires on the same calendar day it trades. SPX has offered them every trading day since May 2022, when Cboe added Tuesday and Thursday expirations and completed the move to daily expiries that had started with Monday/Wednesday/Friday listings. Expiration used to be an event you circled on the calendar. Now it happens every afternoon at 4pm, and the market has quietly reorganized itself around that fact.

The scale is hard to overstate. By late 2025, 0DTE contracts accounted for roughly 60% of all SPX options volume per Cboe. Even ordinary macro days (Fed announcements, CPI prints) push same-day flow to half or more of the total. On peak days the notional traded in SPX 0DTE alone runs around $1 trillion. A single SPX contract at a 5,700 index level controls about $570,000 in notional, so the arithmetic gets big quickly. When daily 0DTE notional sits in the $400 to 600 billion range, a 1% index move forces re-hedging of something like $4 to 6 billion in delta-adjusted exposure. And unlike a monthly book, that hedging does not get spread over days. It happens in minutes, concentrated at whatever strikes hold the open interest.

~60%
of SPX options volume is 0DTE
~$1T
notional SPX 0DTE volume on peak days
$4–6B
delta re-hedged on a 1% move, typical active day

You do not need to trade a single option for this to matter. The hedging generated by this volume shows up as structured, mechanical buying and selling in SPX and ES futures. Structured is the operative word. These flows cluster at specific strikes, they follow a rough daily clock, and both of those things are measurable before the open.
Why gamma turns violent on expiration day

Gamma is the rate of change of delta with respect to the underlying price. Two properties of it explain almost everything about 0DTE behavior. First, gamma peaks at the money and fades for strikes far in or out of the money. Second, gamma grows as time to expiration shrinks, and for an at-the-money option it heads toward infinity as expiry approaches. Put those together and you get a book where the ATM strike on expiration day carries the highest gamma the option will ever have.

Here is what that looks like in practice. Take a 0DTE SPX put struck at 5,700 with the index at 5,720, two hours before the close. That put has almost no delta. It is out of the money and running out of time, so the market treats it as nearly dead. Then SPX drops 25 points to 5,695 and the contract flips in the money. Its delta does not drift from near zero toward 0.50; it snaps there. The dealer who sold that put now has to buy futures, quickly, and the amount of buying required per additional point of decline is far larger than it would be for a 7-day option in the identical scenario. Multiply that single put by the open interest at the strike and you have a hedging cascade that looks, from the outside, like an inexplicable air pocket.

The compression effect: everything a weekly option does over five sessions, a 0DTE contract does in one. Delta migration, theta burn, the gamma spike into expiry: the whole lifecycle compresses into six and a half trading hours. That is why 0DTE-driven moves feel faster and more abrupt than the gamma effects traders knew from the weekly and monthly cycle. Same mechanics, tighter spring.

Near the money, this extreme gamma cuts both ways. When dealers are net long the stuff, their hedging leans against price and pins the index to the busiest strike. Watch any heavy 0DTE session drift sideways into a big round strike through the afternoon and you are watching that magnet work. When dealers are net short, the same math amplifies instead, and small triggers produce outsized moves. Which regime you are in is knowable from the data, and that single distinction does more for intraday expectations than most technical indicators I have used.

The daily clock

0DTE gamma risk follows a rough intraday schedule. Not a timetable you can set trades by, but a recurring shape that shows up most sessions:

9:30–
10:30
The open. Large 0DTE orders placed before the bell all hit at once, and dealers have to hedge them immediately. This is why SPX often prints its biggest move of the day in the first 15 to 30 minutes. The day's GEX structure starts forming here, shaped partly by overnight futures positioning and any theta that burned off overnight.
10:30–
12:00
Structure settles. By late morning the day's Call Wall and Put Wall are usually identifiable, and price tends to oscillate between them. In positive-gamma conditions this is the higher-probability mean-reversion window.
12:00–
14:00
The lull. Time value erodes, OTM 0DTE options bleed out, activity thins. Often the quietest stretch of the day, though fresh 0DTE positioning for afternoon directional plays starts building here.
14:00–
15:00
Gamma goes extreme. ATM gamma is now approaching its peak, so dealer hedging pins price hard to the nearest big strike, and small triggers produce disproportionate moves. Vol frequently picks up in this window.
15:00–
16:00
Collapse and unwind. Remaining time value vanishes, gamma heads to zero at the bell, and dealers unwind the hedges that held things in place. The last 30 minutes often produce a clean directional move once the pinning force lets go.
Where the risk concentrates

Same clock, viewed as amplification risk. The open and the close are where 0DTE hedging is most visible in price action:

9:30–10:15
VERY HIGH
Opening auction sets the initial GEX picture. Institutional 0DTE orders land simultaneously; dealer hedging is most reactive here.
10:15–14:30
LOW–MOD
Mid-session: gamma stabilizes as ATM options shed time value gradually. Moves stay more contained near key GEX levels.
14:30–15:00
ELEVATED
Pin risk begins: dealers adjust hedges as options approach binary win/lose states ahead of expiration.
15:00–16:00
EXTREME
Final hour: gamma is most explosive near ATM strikes. 0DTE vol spikes cluster here, and positions pinning at key strikes can snap into sharp directional moves as they expire.

Illustrative pattern. Actual behavior varies with the expiration type and the macro calendar.

The midday quiet is real, by the way, and data-supported. Absent a catalyst, positive-gamma 0DTE positioning near the money tends to dampen volatility from roughly 10:30am to 2:30pm ET. Research also consistently finds that SPX intraday realized volatility runs higher on heavy 0DTE sessions than on otherwise comparable quiet ones, with the difference concentrated at the open and the close.

What the data shows versus what the headlines say

0DTE gets covered like a casino story: reckless retail traders buying lottery tickets, a doomsday machine waiting to blow up the market. I understand why that version sells. But having watched this flow daily for years, I think most of the popular claims fall apart on contact with the data.

Start with the "0DTE always amplifies moves" claim. Some days it does. Plenty of days it does the opposite. When positioning sits slightly out of the money on both sides (puts below and calls above), net 0DTE GEX comes out positive and dealer hedging acts as a stabilizer, exactly like positive gamma in the multi-day book. The amplification shows up when one side dominates, or when price plows through a cluster of strikes and forces a chain of sequential hedges. Treating every 0DTE day as a powder keg misses that the same flow spends many sessions actively suppressing volatility. Look at the Zero Gamma level for today's expiration before the open. Positive net gamma, expect containment. Negative, expect that moves can run.

Then there is the retail-gambler narrative. The volume data does not support it. A substantial fraction of 0DTE flow is institutional: portfolio hedging from large equity books, vol desks managing their own gamma, and market makers recycling risk. SPX 0DTE in particular, being cash-settled, has become a standard tool for professional same-day tail hedging. Retail participates, sure. But calling this a retail casino is like calling the Treasury market a savings club.

And the advice to simply avoid trading on 0DTE days has aged into absurdity, because every SPX session now is a 0DTE day. Avoiding them means never trading SPX again. The workable response is awareness rather than avoidance: know where today's 0DTE gamma is concentrated before the bell, know whether the net position stabilizes or amplifies, and know the strikes that matter. I would go further. A heavy 0DTE session gives you more information than a quiet one. The levels are bigger, better-defined, and defended by real hedging flow.

The systemic-risk question deserves a straighter answer than either camp gives it. Could 0DTE hedging accelerate a selloff that is already underway? Yes. Mechanically that is exactly what negative gamma does, and August 5, 2024 showed how quickly vol can spiral when everyone needs the same hedge at once. But the doomsday framing skips a detail: because these contracts die at 4pm, the risk resets to zero every night. There is no weeks-long accumulation of dangerous positioning like the short-vol complex that blew up in February 2018. The exposure is huge and violent intraday, then gone. That is a different animal from a slow-building structural imbalance, and in my view a more manageable one.

The one honest caveat: a crowded signal degrades. When enough traders position around the same 0DTE levels, their collective flow can create the very moves they were trying to anticipate, or arbitrage the edge away entirely. 0DTE structure reads cleanest when you treat it as context, and it gets less reliable exactly when a setup becomes popular.
Using 0DTE gamma if you trade ES or NQ

For futures traders the application is mostly about knowing which levels are real and for how long. A few patterns worth watching:

Morning strike clustering
When large 0DTE open interest sits 10 to 20 points from current price, expect the index to orbit that cluster for much of the session as the gamma attraction grows.
The 2pm window
Around 2 to 2:30pm ET, near-ATM 0DTE gamma peaks. This stretch often produces the most explosive 15-minute candles of the day, in either direction. I would rather be positioned before that window than reacting inside it.
Stop placement
Dealers hedging OTM 0DTE options can shove price 5 to 10 points through obvious technical levels before it reverses. Round-number stops on heavy 0DTE days are donations.
The final-hour break
If price pushes through the day's pin strike on volume in the last hour, that often carries into the next session's open.

The other half of the job is layering. 0DTE gamma is one slice of the book; the weekly and monthly expirations sit behind it with far more accumulated open interest. When the 0DTE Call Wall lands on the same strike as the multi-day Call Wall, that level carries double hedging pressure, and fades there are the highest-conviction mean-reversion setups the data gives you. When they disagree (say a 0DTE Put Wall at 5,450 with nothing behind it in the longer book), treat the support as strictly intraday. It dissolves at 4pm with the contracts that created it, so do not lean on it overnight.

My rough rule: monthly GEX for swing structure, weekly for the daily bias, 0DTE for intraday precision. And none of it survives a real macro shock. An FOMC surprise or a geopolitical headline that forces a 30-point repricing invalidates every 0DTE level instantly, because dealers re-hedge the whole book at the new prices. Check the calendar first. These are reference zones to set expectations for range and regime, never lines the market has promised to respect, so confirm with live price action and volume before acting on any of them.

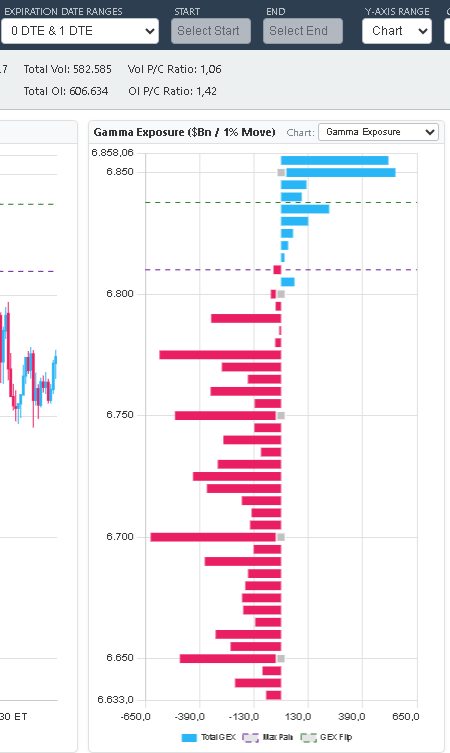
GEX Metrix 0DTE and 1DTE gamma exposure for SPX showing intraday call wall at upper strikes

Here is what this looked like on our SPX chart: 0 DTE and 1 DTE gamma exposure, with the dominant blue Call Wall near 6,850 marking the strongest dealer hedging concentration for the day and red put bars stacked below price. The OI put/call ratio of 1.42 confirms more put open interest than calls, a classic negative-gamma setup. This is the intraday structure that drives ES and NQ every session.

Two questions I get a lot
Does the 0DTE gamma picture actually change during the day, or is the morning snapshot enough?
It changes a lot, and that is the biggest practical difference from multi-day GEX. The ATM strike moves with the underlying, time value decays by the minute, and new 0DTE positions open and close all session. A same-day GEX chart can look genuinely different at 10am, 1pm, and 3:30pm. The morning read gives you the regime and the opening structure, but I would re-check it at least around midday and again before the final hour. Our data updates in 15-minute snapshots for exactly this reason.
What is pin risk, in plain terms?
Pin risk is the tendency of the index to gravitate toward a big high-OI strike into expiration, because the hedging flows around that strike keep pulling price back to it. If a huge 0DTE cluster sits at 5,700, there is a real gravitational pull toward 5,700 in the final hour. For option buyers it is miserable, since their contracts oscillate near worthless while price hugs the strike. For a futures trader it is usable: fade drifts away from the pin while it holds, and respect the break when it doesn't. Because if price does punch decisively through that cluster, the dealers who were stabilizing it have to reverse their hedges, and the resulting move away from the pin can be sharp. Monthly and quarterly expirations run the same mechanics at much larger scale; the OpEx Effects article covers that.