Delta Exposure: Dealer Positioning & Directional Bias

Market makers carry a directional position whether they want to or not, and their hedging of it puts a persistent tilt under futures and equity prices. This is how I read that tilt on the dashboard.

See Delta Exposure
Start with what dealers are actually holding

Gamma gets most of the attention on this site, but when someone asks me why a rally keeps stalling for no obvious reason, delta exposure is usually the first chart I pull up. Rallies that die quietly, dips that get bought before your limit order fills, that kind of thing often has a mechanical explanation sitting in dealer inventory.

The basics first. Delta measures how much an option's value changes for a $1 move in the underlying. A call carries a delta between 0 and +1, a put between -1 and 0. Delta Exposure (DEX) adds up the total delta across everything market makers are holding. Where gamma is symmetric and tells you about the speed of hedging, delta tells you which way the whole book leans. A large negative total means dealers are net short the market, holding more put exposure than call exposure, with the underlying itself as their long-side hedge.

The way I picture it: if dealers are short $5 billion in delta, they are sitting on roughly $5 billion of the underlying as a hedge. Every price move that changes their delta forces them to adjust that hedge. Those adjustments are real orders hitting the tape, and they move price.

One asymmetry worth remembering: dealers short calls hedge by holding the underlying long, dealers short puts hedge by holding it short. Since most markets are put-heavy, total dealer delta usually comes out negative. That number is the structural directional tilt built into current positioning, and it changes slowly enough to matter for more than one session.
Dealer Delta vs Market Direction

Dealer delta works as a background force on price. Slow, but persistent. This is how I interpret the two states:

Net Positive Dealer Delta

Dealers are net long the underlying (more call exposure than put exposure on the book). To rebalance, they may need to sell if price runs too far. That creates mild overhead pressure. You will see this in strong uptrends with heavy call buying.

Net Negative Dealer Delta (Most Common)

Dealers are net short the underlying (put exposure dominates) and hold the underlying as a hedge. As those puts decay or get closed, dealers sell down the hedge. That is structural selling. No panic, no headline behind it, just mechanical unwinding. And it shows up whether or not the news that day is good.

Why is dealer delta usually negative? Institutions and retail alike buy puts for protection far more often than they buy calls. Dealers take the other side, selling the puts and hedging with short underlying positions.

The Zero Delta Level: A Second Structural Reference

The Zero Delta Level is the price where total dealer delta crosses zero: neither net long nor net short. It behaves a lot like the Zero Gamma level, just on a slower clock. Delta Exposure sits in the Plus tier.

Reading it is simple enough. Above Zero Delta, dealers hold net long underlying, so there is potential selling overhead as price rises. Below it, they are net short, which means structural buying support under the market. Right at the level, directional hedging flow thins out and price can move more freely in either direction.

Delta vs Gamma levels: Zero Gamma matters more for the intraday volatility regime. Zero Delta is the one I check for multi-day or swing directional bias. I keep both on screen, one rarely tells the whole story alone.
GEX Metrix Delta Exposure chart for SPX showing dealer delta positioning by strike with Max Pain level

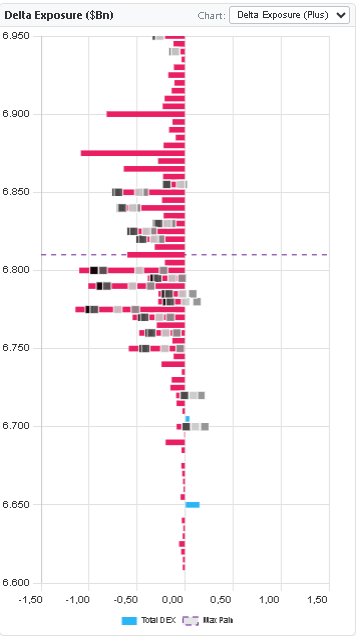
Delta Exposure ($Bn) on the GEX Metrix dashboard, dealer delta positioning by strike. Blue dashed line is Max Pain. The mix of positive and negative bars reflects hedging spread across the strike range; taken together, that is the directional tilt built into current dealer positioning.

Delta Exposure vs Gamma Exposure: What Each Tells You

People treat these as interchangeable. They aren't. Delta and gamma come from the same options data but answer different questions:

Gamma Exposure tells you...

  • Speed of hedging at each level
  • Whether today is likely a range day or a trend day
  • Where support and resistance carry the most weight
  • Intraday volatility regime
  • Short-term price magnetism

Delta Exposure tells you...

  • Directional bias of current positioning
  • Structural buying or selling overhang
  • Multi-day trend pressure
  • Where dealer rebalancing will generate flows
  • Put/call positioning skew
Combined read: positive gamma (stabilizing) alongside a large negative dealer delta means dealers are hedging a big short position. Expect a range-bound day, but that selling overhang can cap upside across several sessions.
How Futures Traders Use Delta Exposure

For ES and NQ traders, the main use is as a swing-trade filter. In a deeply negative delta environment, upside momentum tends to fade as dealers unwind their long hedges. I would rather be looking for shorts, or at least tightening targets on longs.

There is a confirmation angle too. When a rally pushes price through the Zero Delta level, dealer covering can kick in and amplify the move. Watch for acceleration there rather than fading it. OpEx week is its own animal: delta decays fast into expiration, dealers unwind large hedge positions, and in put-heavy environments that unwind often lands bullish. The OpEx effects article covers this in more detail.

And if you trade relative value, comparing delta exposure between SPX and NDX can tell you which index carries the bigger structural headwind before you size the legs.

Delta exposure works as a filter, not a trigger. Use it to judge whether the structural environment supports your directional idea. On its own it is not an entry signal, and treating it as one is how people get chopped up.
The Delta Profile: Simulated Dealer Flows Across Price Range

The Delta Profile answers a what-if: how would total dealer delta change at each price level? It simulates dealer hedging flows as price moves through the strikes, and the shape of the curve is what you are reading.

  • A steep negative slope marks a strong structural selling zone as price rises
  • Flat sections mean low delta flow pressure, so price moves freely there
  • A positive slope below current price is structural buying support
  • Zero-line crossings are the directional inflection points
GEX Metrix Delta Exposure chart for SPX, dealer delta by strike showing directional positioning skew

Delta Exposure detail. The concentration of bars near current price (roughly 6,775 to 6,850) shows where dealer delta rebalancing will be most active. Strikes carrying a large delta overhang generate structural buying or selling as positions get unwound or rolled.

Delta Exposure During Market Stress

This is where the chart earns its place, in my opinion. Delta dynamics change character completely when the market is under stress, and the mechanics run opposite to what most people's gut says:

During a sharp selloff

Put buying surges. Dealers take the other side, getting shorter puts and hedging by buying more of the underlying. As put open interest grows, dealer delta becomes increasingly positive (long underlying). So while the tape looks like pure liquidation, a structural support floor is quietly being built below price. I think of it as the market's elastic band. March 2020 stretched that band about as far as it goes, and the eventual snap-back was violent partly because so much dealer long-hedge inventory was sitting under the market. The August 5, 2024 vol spike ran a compressed version of the same script.

During a grind-up rally

Call buying picks up and put protection gets abandoned. Dealers accumulate longs to hedge the calls they have sold, so dealer delta tilts positive. Then the calls decay, the hedges have to come off, and that unwinding leaks steady selling pressure into the market. It is why rallies can stall on days when the news is genuinely good. Nothing broke. The hedge just came off.

The contrarian read: extreme delta readings tend to precede mean reversion. A historically large negative dealer delta usually means too much put protection got bought, which leans bullish over multi-week timeframes. Usually, not always. Stress can persist longer than the positioning argument suggests it should.