Vanna & Charm: Advanced Options Flow

The two second-order Greeks behind vol-driven rallies and end-of-week dealer flows, and how I read both charts on the dashboard before I trust any morning move

See Vanna & Charm Data
Vanna: the vol-to-delta link

Some of the strangest rallies you will ever watch have no news behind them at all. VIX bleeds lower for a few hours and the index just grinds up. If you have ever sat there asking "who is buying this?", the answer is usually vanna. It measures how much an option's delta changes when implied volatility changes: ∂Δ/∂σ, the partial derivative of delta with respect to volatility.

For a market maker hedging an options book, that is a headache. When VIX moves, the book's delta moves even if price has not gone anywhere. So the dealer has to re-hedge, and that re-hedging shows up as directional flow in the underlying. Flow driven entirely by volatility, not by anyone's view on price.

The vol-crush rally

When VIX drops sharply, out-of-the-money call deltas increase. Dealers short those calls have to buy more of the underlying to stay flat. Price rises because falling volatility forces mechanical buying, with no bullish news required. In my experience this is the single most common source of the "no catalyst" rally.

The mechanics run both ways. VIX drops, dealers buy, price rises. VIX spikes, dealers sell, price falls. The effect is strongest when there is a lot of OTM open interest sitting on the board, because those are the strikes whose deltas swing hardest with vol. Whenever someone can not explain a rally after a stretch of volatility compression, vanna is my first suspect.
Charm: delta decay

Here is the mistake I see futures traders make constantly: treating the first half hour of a Thursday or Friday session as real directional conviction. A lot of it is charm. Charm (some desks call it delta decay) measures how much an option's delta changes as time passes: ∂Δ/∂t, the partial derivative of delta with respect to time.

Every day that passes changes the delta of every option on the board, even if price and volatility sit still. Dealer hedge ratios drift overnight, which means they have buying or selling to do at each open just to get back to flat.

Why the open sells off

Overnight, OTM put deltas decay toward zero. Dealers who were short those puts (and long the underlying as a hedge) now need less underlying. They sell the excess at the open, and that systematic early-session selling gets heavier on Thursdays and Fridays as expiration approaches.

  • Charm flows peak as options approach expiration, so Thursday and Friday matter most
  • Decaying OTM puts: dealers sell their underlying hedge
  • Decaying OTM calls: dealers buy back the short hedge instead
  • The net result is a repeatable intraday directional pattern near OpEx
The Weekly Vanna-Charm Cycle

A lot of what looks like random week-to-week behavior is actually the same cycle repeating around weekly expirations. This is how I think about each day.

MON
Fresh positioning

Monday is the quiet one. New weekly options get sold and bought, but expiration is still far enough away that vanna and charm exposures are small. Structure-wise, this is usually the day with the least mechanical pressure on price.

TUE
WED
Vanna's window

By midweek, OTM options still carry meaningful delta sensitivity to vol, so any VIX move gets translated into dealer flow. A VIX crush on a Wednesday afternoon will often produce a vanna-driven buying surge in ES and NQ that leaves people hunting for a headline that does not exist. If the index rallies while VIX falls and nobody can tell you why, that is your candidate.

THU
The Thursday trap

One day to weekly expiration and charm is at full strength. Overnight decay forces dealers to rebalance at the open, which tends to push the first hour or two in one direction. Which direction depends on whether calls or puts dominate open interest, so check the chart before assuming.

FRI
OpEx

Charm flows hit their maximum at the open as the last of the overnight decay gets hedged out. Meanwhile gamma on near-expiry ATM strikes explodes, so pin risk is extreme, and whatever vanna exposure remains collapses because vol sensitivity goes to zero at expiry. After the open, price tends to gravitate toward the highest open interest strike and sit there.

Vanna & VIX: Vol-Driven Rallies and Selloffs

The VIX-vanna relationship explains some of the moves that confuse people the most. Both directions are worth walking through.

VIX Spike Scenario (Vanna Headwind)

When VIX spikes, OTM put deltas increase fast. Dealers who sold those puts suddenly carry more delta exposure and have to sell more of the underlying to stay hedged. Here vanna works against price: higher vol forces more selling, which amplifies the initial decline. This is a big part of why selloffs accelerate once VIX crosses certain levels.

VIX Crush Scenario (Vanna Tailwind)

When VIX drops sharply (a selloff resolves, an event passes), OTM call deltas increase and dealers holding short calls must buy underlying. Falling volatility mechanically forces buying. The V-shaped recovery everyone marvels at is partly a vanna flow. Traders who wait for a fundamental catalyst to confirm these moves usually miss the mechanical driver entirely.

So when VIX is elevated and starts rolling over, I expect vanna-driven buying to accelerate any recovery rally, often well before a headline shows up to explain it. That expectation alone has kept me from fading a lot of recoveries I did not "believe in".

When Vanna Overrides Gamma

On any given day, either gamma or vanna is the dominant dealer hedging force. Knowing which one is in charge decides which chart deserves your attention.

Gamma dominant (stable vol)

When VIX is calm and ATM options dominate positioning, gamma drives intraday price action. Price orbits the gamma walls, and GEX levels are your primary reference points. Vanna adds context but will not override the gamma structure.

Vanna dominant (vol on the move)

When VIX itself is moving sharply (daily swings above 3%), vanna flows can overwhelm the gamma map. GEX levels that held all month suddenly fail to contain price, because dealers are re-hedging for vol changes rather than price changes. In that environment I track VIX movement as the primary input and treat strike levels as secondary.

My working threshold: once the VIX daily range exceeds 3 to 4 points, I assume vanna effects dominate and put less weight on GEX price levels. When VIX is quiet, the gamma levels earn their reliability back.
Reading the Vanna Chart

Vanna and Charm sit in the Pro tier of the dashboard. This is how the vanna panel actually gets used, at least by me.

Before every Thursday session I check charm exposure first, then vanna. A large negative charm reading means real dealer selling at the open, so I size down longs or simply wait for the unwind to finish before entering. For vanna, the trigger I care about is VIX dropping more than 5% intraday from an elevated level. When that happens I expect vanna-driven buying regardless of the news flow, and it is especially forceful when there is heavy OTM call open interest on the board.

Two more habits worth stealing. After a sharp decline with a VIX spike, the vanna chart tells you when the vol-driven selling will mechanically exhaust itself, which in my experience times recoveries better than any fundamental read. And during OpEx week, I lean away from directional bias and toward mean reversion as charm flows build into Thursday and Friday. The mechanical unwind runs over technical setups more often than not.

GEX Metrix Vanna Exposure chart for SPX showing predominantly positive vanna bars by strike

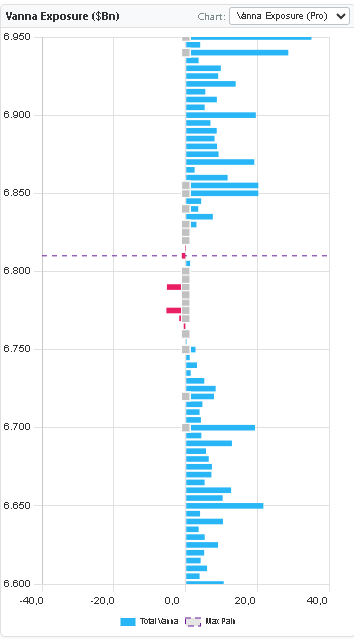
Vanna Exposure ($Bn) on our SPX chart. Look at how one-sided the blue is: dealer vanna concentrated long across nearly every strike. From here, a VIX drop forces dealer buying across all of them at once. That is the mechanical engine behind a "no-catalyst" recovery rally. Purple dashed line is Max Pain.

Reading the Charm Chart

Charm produces one of the most repeatable patterns in options-driven markets: systematic pressure at the open, growing as expiration approaches.

Why does the open so often set the day's direction? Because overnight theta burn changes every dealer's hedge ratio before the bell. When charm exposure is large, dealers have rebalancing to execute at or shortly after the open, and that early push frequently defines the session's structure.
GEX Metrix Charm Exposure chart for SPX showing predominantly negative charm bars indicating systematic delta decay selling pressure

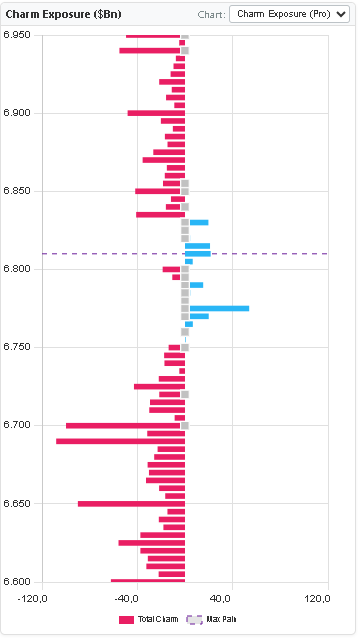
Charm Exposure ($Bn) for the same SPX snapshot. The wall of red is time-decay driven delta erosion into expiration. That concentration means systematic selling at the Thursday and Friday opens. Plenty of futures traders read that opening flush as conviction. It isn't. Purple dashed line is Max Pain again.

Do not trade the first 15 minutes of a Thursday or Friday session without checking charm exposure first. Strong charm flow in the first hour produces moves that look real and then fade the moment rebalancing completes.