Gamma Exposure Levels for NQ and ES Futures Trading

How options market maker positioning creates the support, resistance, and momentum you see on your ES and NQ charts. And how I check it before every session.

Explore Gamma Levels
Why a futures trader should care about options data

Most futures traders I know have never opened an options chain in their life and honestly they do not need to. What they do need to know is that the dealers hedging SPX options are trading ES all day long, in size, and their trades are entirely predictable once you can see their book.

Dealer hedging is mechanical and non-discretionary. It follows math, not opinion. Delta drifts, the desk rebalances, and it does not matter what the chart pattern says or what the news is. The result is a set of specific price levels where large amounts of automated buying or selling will show up.

If you trade ES or NQ without this data, you are trading against people who know where that flow steps in. That is a rough way to make a living.

The core mechanic: options customers push risk onto dealers, and dealers offload that risk into index futures. So the "mystery" support that held three times this week, or the afternoon drift into a round number, often has a very unmysterious source: a hedging desk working its delta.
Morning bias: the one check I never skip

Before the session, check where ES or NQ is set to open relative to the Zero Gamma level. One number. It tells you more about the character of the coming day than most of your indicators combined.

Opening above Zero Gamma

Dealers are net long gamma, so they sell rallies and buy dips mechanically. Expect compression and a range-bound day. Mean reversion works, fading at gamma walls works, and breakouts that do not confirm with volume tend to die quietly.

Opening below Zero Gamma

Dealers are net short gamma. Now they amplify every move, selling into declines and buying into rallies. Trending conditions, wider ranges, momentum continuation. Trend-following and breakout strategies outperform. Fade these moves and you will usually end up donating money to the trend.

This one check reshapes your whole playbook for the day. I know futures traders who will not put on a single trade before confirming the gamma regime, and I think they have the priorities right.
Three gamma setups that come up again and again
Setup 1: Gamma Wall Rejection (Fade Trade)

Environment: positive gamma, price inside the dealer-stabilized range.

Trigger: ES or NQ rallies into a large Call Wall, meaning a heavy positive gamma concentration overhead.

What happens: dealers have to sell futures as price approaches the wall to stay delta-neutral. That is a ceiling. Price stalls there far more often than chance would suggest.

Trade: short near the Call Wall, target the mid-range or the Put Wall, stop above the wall with a buffer.

The mirror image works too: long near the Put Wall in positive gamma, since dealers buy as price drops toward the put concentration.

Setup 2: Negative Gamma Breakout (Momentum Trade)

This is the opposite animal. Price breaks below the Zero Gamma level on volume, closes there, and does not recover quickly. Dealers flip from stabilizing to amplifying. Every leg lower forces more selling, every bounce gets sold into by fresh hedging, and moves become self-reinforcing.

The cleanest entry in my experience is not the initial break. It is the retest of Zero Gamma from below, which now acts as resistance. Short there, target the next Put Wall or structural level underneath. And respect the regime: negative gamma days can run much further than feels reasonable.

Setup 3: Gamma Pinning Near OpEx (Range Trade)

Late in OpEx week, usually Thursday and Friday, watch for ES or NQ drifting toward a strike with very high open interest in the nearest expiration. As expiry approaches, gamma at that strike grows exponentially, and dealer hedging around it gets so aggressive that price behaves like it is magnetized to the level.

How I trade it, in rough order:

Before the session: identify the likely pin strike from the open interest map.

During the session: trade a tight range around it, using the pin as the anchor for mean-reversion entries.

Monthly OpEx Fridays and quarterly expirations are where this behaves best. Watch any OpEx Friday afternoon and you will see it.

Combining setups: the trades I like most stack gamma structure on top of technical confirmation. A gamma wall rejection that also lines up with VWAP or the prior session high is a meaningfully better bet than either signal on its own.
What this looks like on the dashboard
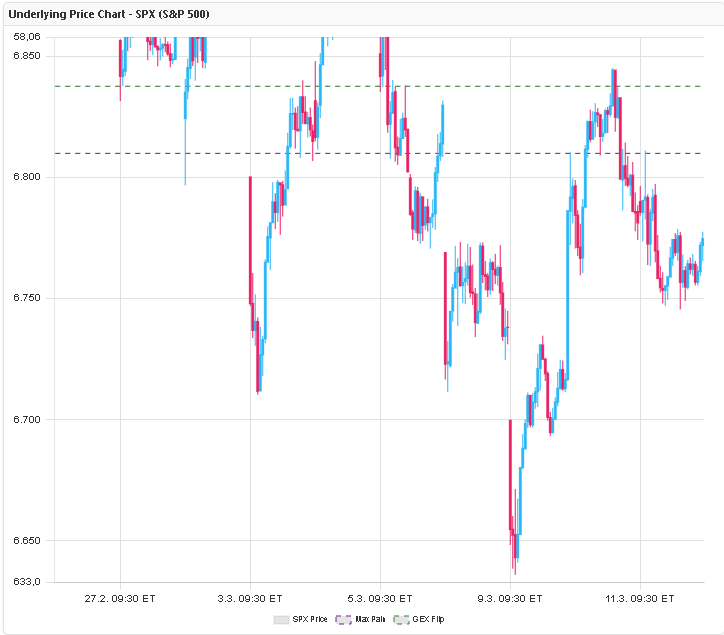
SPX Underlying Price Chart with GEX structural levels, GEX Flip and Max Pain horizontal lines overlaid on candlestick chart

The SPX Underlying Price Chart with key gamma levels drawn as horizontal lines. Green dashed is Max Pain, gray dashed is GEX Flip (Zero Gamma). Notice how the sharp Feb-Mar decline happened with SPX below the GEX Flip line: negative gamma conditions amplifying every move in ES and NQ.

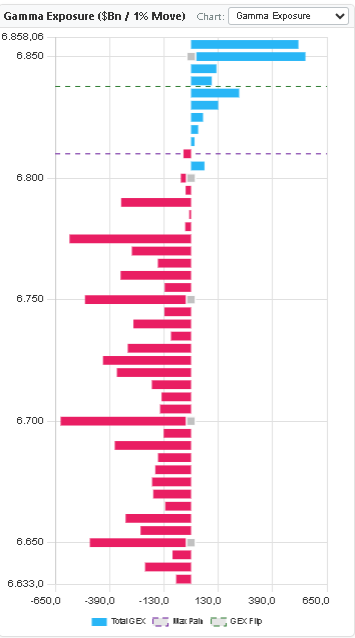
SPX Gamma Exposure bar chart showing Call Wall and Put Wall levels used by ES futures traders

SPX Gamma Exposure in Split View. The large blue call concentration around 6,850 is the Call Wall acting as overhead resistance for ES. The red put bars below current price mark your downside support zones. These levels shift through the session as flow develops, so don't screenshot them at 9am and call it done.

My five-minute pre-session checklist before the 09:30 opening bell
Check the Zero Gamma level

Is ES/NQ opening above it or below it? That is your bias for the day: compression or expansion.

Find the nearest Call Wall and Put Wall

These frame the expected range. In positive gamma, price rarely sustains a move beyond them without a genuine catalyst.

Note the High Volatility Level (HVL)

A break through HVL is often the start of a real directional move. I use it as a filter: do not fade something that just pushed through HVL with conviction.

Check expiration proximity

OpEx week? Big 0DTE positions building? Near-expiry gamma is more potent and produces sharper reactions at the levels.

Draw the levels on your chart

Mark Zero Gamma, Call Wall, and Put Wall on your ES/NQ chart before the open. These are your reference lines for the session.

09:30 ET — the open
Which underlyings map to which futures

GEX Metrix covers a wide instrument list, but for futures work you mostly care about the index options that dealers hedge in your contract. Here is the mapping I use:

Underlying Relevant Futures Data Type
SPX / SPY ES (S&P 500) Full GEX, Delta, Vanna
QQQ / NDX NQ (Nasdaq) Full GEX, Delta, Vanna
IWM / RUT RTY (Russell 2000) GEX, Delta
DIA YM (Dow Jones) GEX
GLD / SLV GC, SI (Metals) GEX
USO CL (Crude Oil) GEX
Start with SPX/ES. It has the deepest options market, so the gamma effects are strongest and cleanest there. Expand to the others once the SPX picture makes sense to you.
The mistakes I see futures traders make with GEX

The biggest one, by a wide margin, is ignoring the regime. Running mean-reversion strategies on a negative gamma day means getting stopped out over and over while price trends away from you. The regime check takes ten seconds. Do it first.

Stop placement is the next problem. Traders park stops exactly at the Call Wall or Put Wall, which is precisely where dealer hedging churns the tape. Give the level a buffer, or the hedging flow will tag your stop right before price reverses. It stings every time.

A subtler mistake is treating GEX as a signal generator. It isn't one. GEX gives you structure. You still need a trigger: volume, a candlestick pattern, some technical confirmation. Related to that, remember which expiration matters. The levels doing the real intraday work come from the nearest expiry; back-month options carry much less gamma punch during the session.

And finally: the levels move. GEX shifts as flow develops through the day, so check again at midday, and definitely after any large economic release. The map you drew at the open is a starting point, not gospel.

Gamma levels next to chart patterns

The distinction is simple enough. Chart patterns describe what has happened. Gamma levels describe what dealers will be forced to do. One is history, the other is standing orders waiting to fire.

What gamma analysis adds. Pre-defined support and resistance from actual positioning data. A volatility regime read (range day vs trend day). A mechanical explanation for why a level held or broke, which chart history alone can not give you.

How I combine them: gamma levels define the structure of the day, and technicals (VWAP, prior session levels, price action) time the entry within that structure. Both together beat either one alone.
GEX analysis does not predict every move. When macro data or a headline genuinely surprises the market, gamma effects get overwhelmed for a while. Size your positions for that uncertainty, always.