Gamma Squeeze Explained

The dealer hedging loop that turns aggressive call buying into a vertical price move, and where the buildup shows in GEX data before most people see anything on the chart

Monitor GEX for Squeeze Setups
The machine behind the move

Everyone learned the phrase "gamma squeeze" in January 2021, when GME went vertical and financial TV spent a week trying to explain options hedging to a general audience. Most of those explanations got the mechanics half right. The part that matters: nobody in the loop is speculating. Dealers who buy the stock during a squeeze are not bullish. They are hedging, and the hedging itself moves the price.

The raw material is out-of-the-money call options. When traders buy OTM calls in size, the dealers on the other side are short those calls, so they buy the underlying to flatten their delta. That buying lifts price. As price rises, the calls that were OTM drift toward the money and their delta climbs, so the dealers have to buy more stock to stay hedged. Which lifts price again.

The loop in compressed form: traders buy OTM calls, dealers buy stock to hedge, price rises, those calls gain delta, dealers buy more stock, price rises further. It runs until the call buying stops or the options expire.

A short squeeze needs short sellers to exist first. A gamma squeeze does not. It is pure options plumbing, and it can fire in a stock with almost no short interest at all.
Why it goes vertical instead of drifting

The speed comes from gamma being non-linear. A few things stack on top of each other:

  • Delta does not climb in a straight line. A 0.10-delta call approaching its strike sees the rate of change itself accelerate. That is gamma doing its job.
  • Short-dated calls carry the most gamma per dollar, which is why weeklies and 0DTE contracts are the usual squeeze fuel.
  • Dealer inventory is big. Millions of contracts across the book means even a small delta shift translates into serious share purchases.
  • Thin liquidity multiplies everything. In a low-volume name, or around the open and close, each hedging dollar moves price further.

And then there is reflexivity, the least mechanical piece. A stock going vertical attracts more call buyers, who add more gamma, which forces more hedging. The squeeze feeds itself in real time. That is the part models struggle with and crowds understand instinctively.

The Four Stages of a Gamma Squeeze

I break these out because each stage looks different on the dashboard, and by the time stage three is obvious on a price chart, most of the trade is gone.

Stage 1: Quiet accumulation

This stage is invisible on a price chart, which is exactly why it is the interesting one. Traders are buying cheap, short-dated OTM calls a strike or two above spot, and price does nothing unusual. Maybe a slow grind higher, maybe flat. On the GEX profile, though, you can see green call bars building at strikes above current price and volume in near-expiry calls running above its recent average. That is the whole tell at this point. Small, but it is there before anything else is.

Stage 2: Dealers start hedging

Mechanics: the dealers who sold those calls now carry enough short delta that they have to buy stock. The buying is steady rather than dramatic, a low-volume grind toward the strikes where the calls sit.

On the dashboard: call gamma at the OTM strikes is no longer modest. The call wall has shifted up with the accumulated OI, and total gamma is rising fast. Price is walking toward the wall, and volume picks up as it gets close.

Stage 3: OTM becomes ATM and the thing ignites

Now the calls that were bought at maybe 0.15 delta are near the money, and delta jumps toward 0.45 or 0.50. The dealer hedging requirement roughly triples on the same position, all at once. This is the squeeze itself: a rapid, high-volume surge, a breakout from the prior range, the vertical candle everyone screenshots. The call wall sits at or right below spot, gamma at that strike is peaking, and fresh call buying starts appearing at higher strikes. If the name also has a big short base, shorts start covering here, and you get gamma squeeze and short squeeze running in the same direction. GME in January 2021 was that combination. Watching it from the outside, the striking thing was not the crowd but how textbook the hedging math was underneath the circus.

Stage 4: Extension or exhaustion

Two exits, and the GEX data usually tells you which one you are getting. If new OTM call OI keeps appearing at higher strikes, the squeeze has fresh fuel and extends, though usually with fading momentum. If gamma at the upper strikes starts declining instead, the fuel is gone. When call buying stops, dealer buying stops with it, and early call buyers taking profit can make the reversal nearly as violent as the move up. Watch where the new OI is forming, not where price is. Price at this stage is a lagging indicator of its own squeeze.

Gamma Squeeze vs Short Squeeze: Key Differences

People use the two terms interchangeably, and the confusion costs money, because the two setups are visible in completely different data.

Gamma Squeeze Short Squeeze
Driven by options dealer hedging mechanics Driven by short sellers forced to cover
Requires large OTM call open interest Requires high short interest ratio
Can happen in low-short-interest stocks Requires significant existing short base
Speed: can start within hours Speed: usually develops over days
Visible in GEX data before it starts Visible in short interest data
Ends when call buying stops Ends when short covering exhausts
Most powerful near expiration Most powerful when float is low
The most explosive version is both at once: heavy short interest plus aggressive near-expiry call buying. The gamma squeeze forces price up, rising price triggers short covering, and the covering amplifies the move the dealers are already hedging into. That stack is what made January 2021 historic rather than just unusual.
What I check in GEX before calling it a setup

No single line item makes a squeeze. I want several of these at the same time:

  • OTM call gamma growing fast. A strike 2-5% above spot suddenly loading up with short-dated call OI is the classic footprint.
  • Call gamma outpacing put gamma. When the call side of total GEX is growing faster, the dealer hedging bias tilts toward buying.
  • A call wall sitting just above price. Dealers are already buying into it as price approaches.
  • The near-dated expiries doing the accumulating. This week's and today's contracts building gamma faster than the back months. Near-expiry gamma is where the horsepower is.
  • Clean terrain above the wall. Little negative gamma overhead means once the squeeze fires, there is not much structure to slow it down.
GEX Squeeze Setup, Live Example
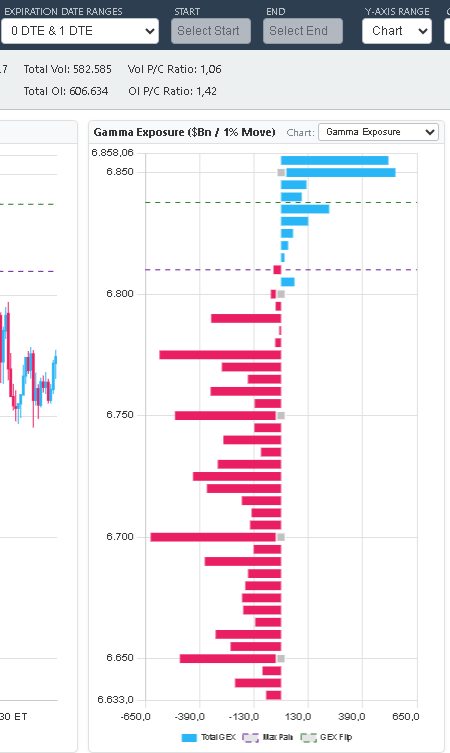
GEX Metrix 0DTE gamma exposure showing large Call Wall buildup at upper strikes, a classic gamma squeeze setup

GEX Metrix, 0 DTE & 1 DTE Gamma Exposure. Look at the top of the chart first: that dominant blue Call Wall at the ~6,850 strike is the structure this whole article is about. As price approaches a concentration like that, dealer buying intensifies. If traders keep piling into those OTM calls, the loop self-reinforces. Total Vol: 582,585. OI P/C Ratio: 1.42.

This is the same 0DTE view covered in the 0DTE flow guide. For squeeze-watching purposes, the question I ask of this screen is simple: is the wall above price growing between snapshots, or shrinking? Growing wall plus rising near-expiry call volume is the setup. A wall that is melting means the fuel is being pulled.

Index squeezes: the ES/NQ version

Squeezes are not only a meme-stock thing. The same mechanics run at index level, and SPX/NDX squeezes drive ES and NQ futures directly.

Index gamma squeeze conditions. When SPX call buying surges across multiple strikes, the combined dealer hedging demand can push ES sharply higher on days with no news at all. The catalyst is the options market itself. Traders staring at headlines looking for the reason usually do not find one, because there isn't one.

The signal I use for ES/NQ: SPX call gamma above spot doubling or tripling within a single session. When that happens, I expect hedging-driven acceleration in the futures, whatever the news flow says.
One caveat from experience: index squeezes die faster than single-stock squeezes. SPX liquidity is deep enough that dealers source their hedges without much slippage, so the reflexive amplification is weaker. Tighter targets, faster exits.
Risk Management Around Gamma Squeezes

Squeezes look like free money in hindsight and behave like a trap in real time. A few rules I would hand anyone trading around them.

Do not chase the vertical candle. The trade (if there is one) lives in stages one and two, when the GEX buildup is visible and the chart is still boring. Buying into stage three means you are providing exit liquidity to people who read the data earlier than you did. And the reversal when call buying stops can be as violent as the move up, because dealer buying does not taper politely. It just stops.

Watch the wall itself, not just price. If the call wall you identified starts shrinking (contracts closed or rolled), dealer buying is about to slow, and that is usually the first exit signal you get. Declining volume on a still-rising price says the same thing a different way.

Know the expiration calendar cold. Weekly-option squeezes tend to peak Thursday afternoon and exhaust by Friday's open, because gamma collapses to zero at expiry and takes the hedging demand with it. And size for the range, not the trend: squeeze days have brutal intraday swings, so a position that feels comfortable on a normal day is too big on one of these.